

Question: Give the formulas for and plot average fixed cost, AFC, marginal cost, MC, average variable cost, AVC, and average cost, AC, if the cost function
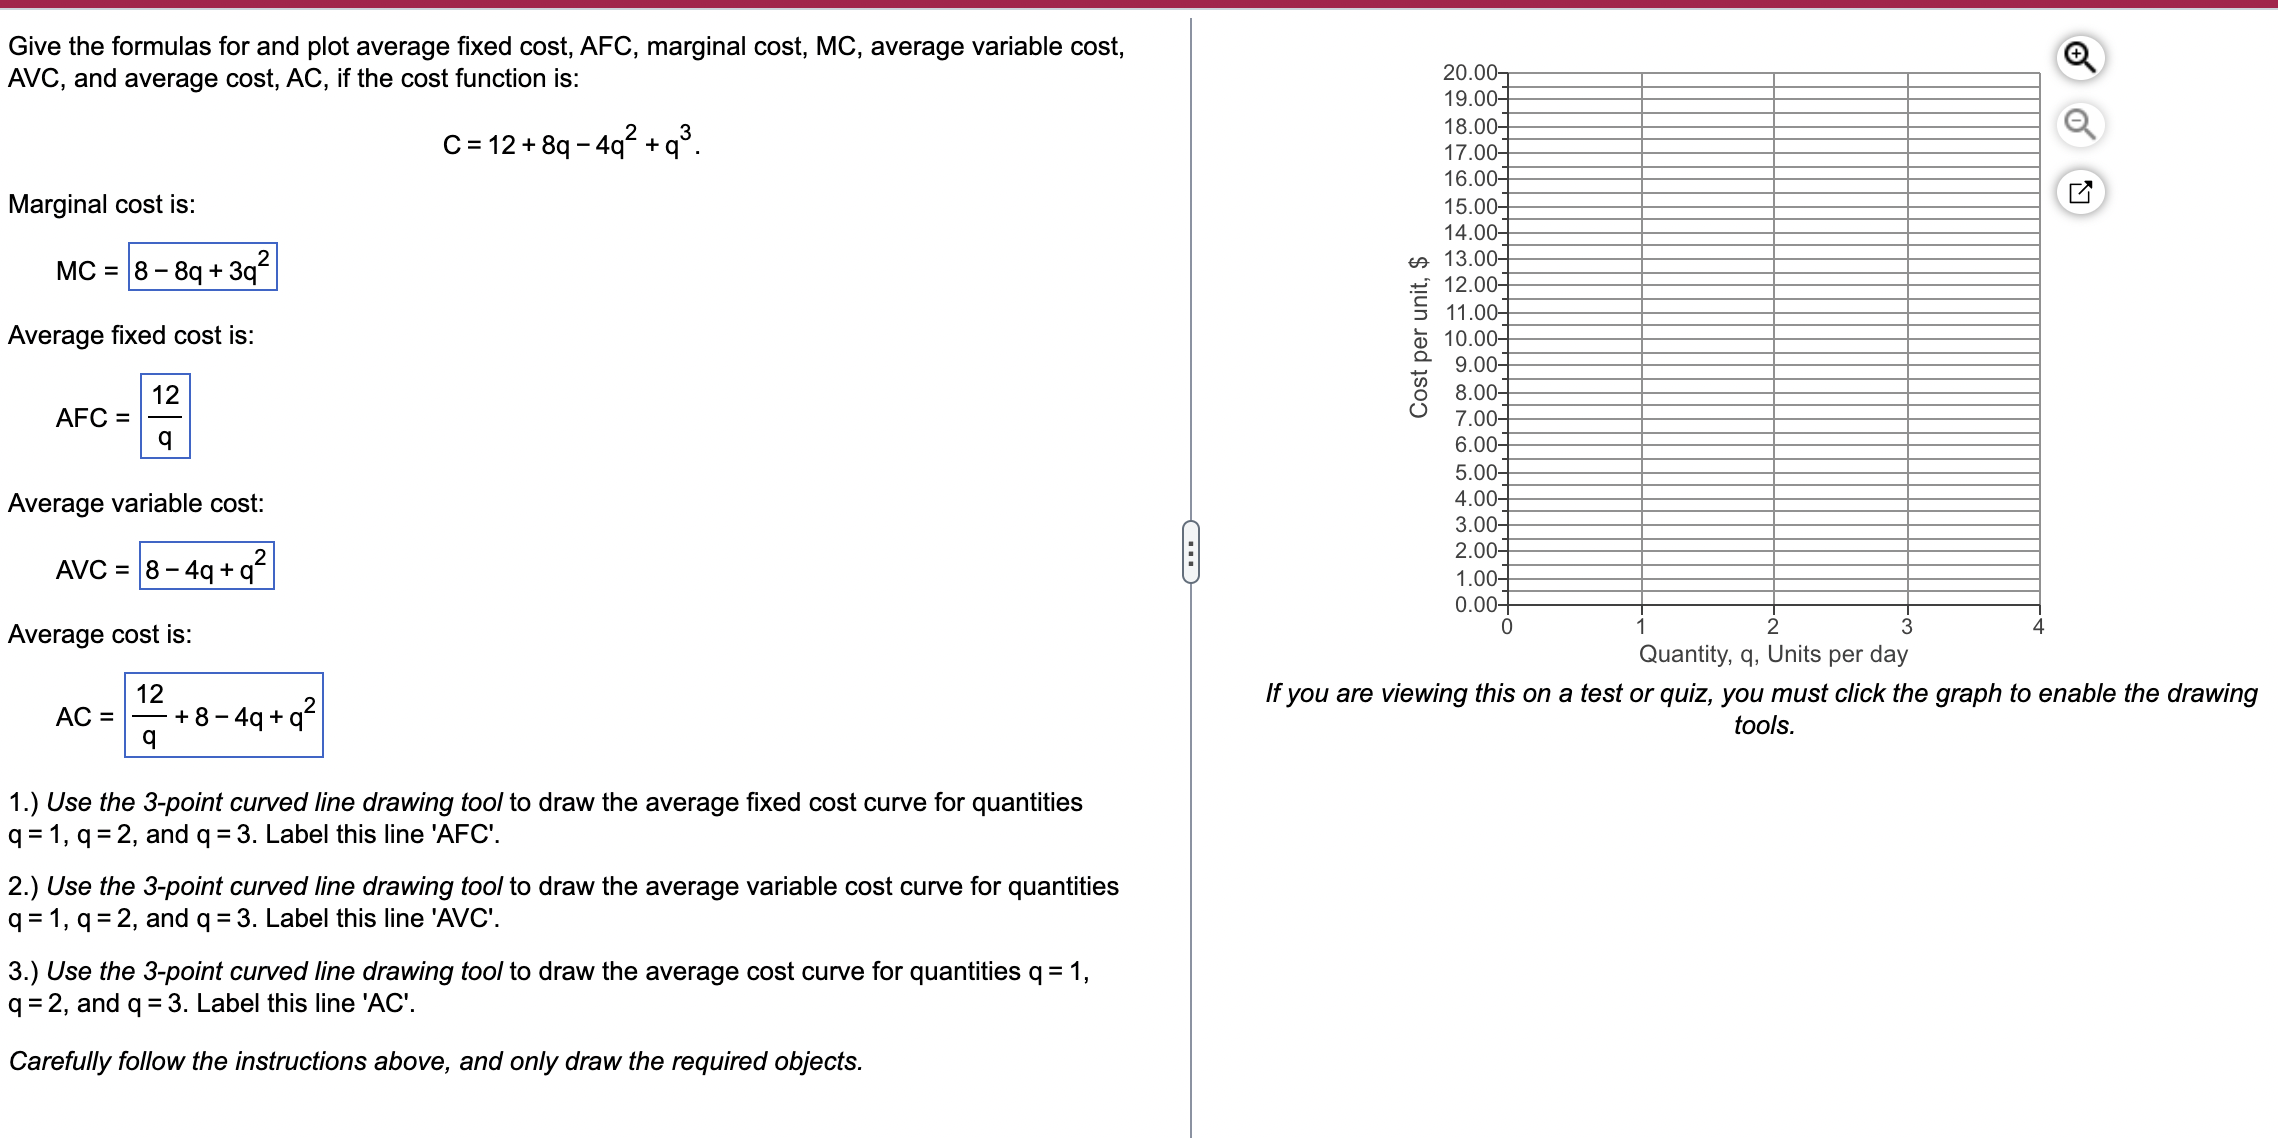

Give the formulas for and plot average fixed cost, AFC, marginal cost, MC, average variable cost, AVC, and average cost, AC, if the cost function is: 20.00 19.00- C = 12+8q -4q2+ q3. 18.00- 17.00- 16.00- Marginal cost is: 15.00-7 14.00- MC = 8 -8q + 3q2 13.00- 12.00- 11.00- Average fixed cost is: Cost per unit, $ 10.00- 9.00- 12 8.00- AFC = 7.00- q 6.00- 5.00- Average variable cost: 4.00- 3.00- AVC = 8 -4q+ q2 2.00- 1.00- 0.00- Average cost is: Quantity, q, Units per day If you are viewing this on a test or quiz, you must click the graph to enable the drawing AC = 12 -+8-4q+ q2 tools. 1.) Use the 3-point curved line drawing tool to draw the average fixed cost curve for quantities q = 1, q= 2, and q = 3. Label this line 'AFC'. 2.) Use the 3-point curved line drawing tool to draw the average variable cost curve for quantities q=1, q=2, and q = 3. Label this line 'AVC'. 3.) Use the 3-point curved line drawing tool to draw the average cost curve for quantities q = 1, q = 2, and q = 3. Label this line 'AC'. Carefully follow the instructions above, and only draw the required objects
Step by Step Solution
There are 3 Steps involved in it

Get step-by-step solutions from verified subject matter experts