

Question: Give the formulas for and plot average fixed cost, AFC, marginal cost, MC, average variable cost, AVC, 12.00- and average cost, AC, if the cost

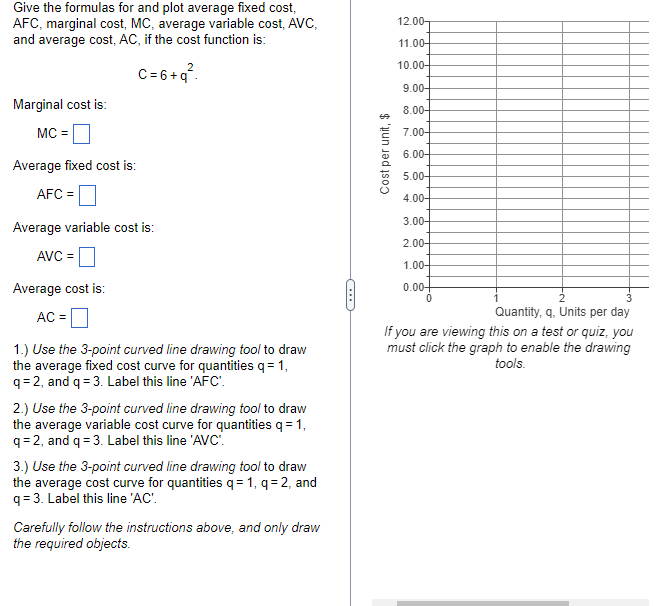
Give the formulas for and plot average fixed cost, AFC, marginal cost, MC, average variable cost, AVC, 12.00- and average cost, AC, if the cost function is: 11.00- 10.00- C=6+q 9.00- Marginal cost is: 8.00- MC =] 7.00- Cost per unit, $ 6.00- Average fixed cost is: 5.00- AFC = 4.00- Average variable cost is: 3.00- 2.00- AVC = 1.00- Average cost is: 0.00+ AC =] Quantity, q, Units per day If you are viewing this on a test or quiz, you 1.) Use the 3-point curved line drawing tool to draw must click the graph to enable the drawing the average fixed cost curve for quantities q = 1, tools. q=2, and q =3. Label this line 'AFC' 2.) Use the 3-point curved line drawing tool to draw the average variable cost curve for quantities q = 1, q= 2, and q =3. Label this line 'AVC". 3.) Use the 3-point curved line drawing tool to draw the average cost curve for quantities q = 1, q=2, and q =3. Label this line 'AC'. Carefully follow the instructions above, and only draw the required objects
Step by Step Solution
There are 3 Steps involved in it

Get step-by-step solutions from verified subject matter experts