

Question: Given a dataset D= {(Ii, yi), i = 1, 2, ...,N} where both X; and yi are scalars. We define the line as y =
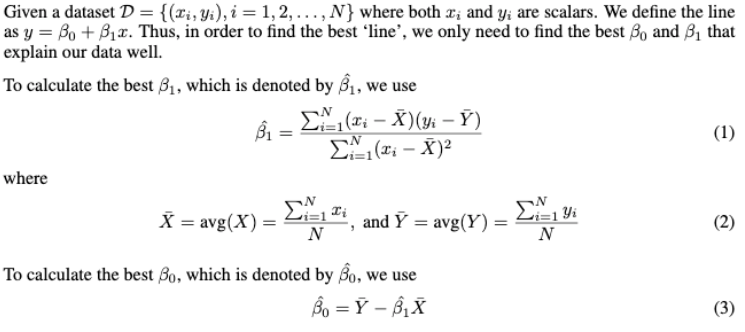
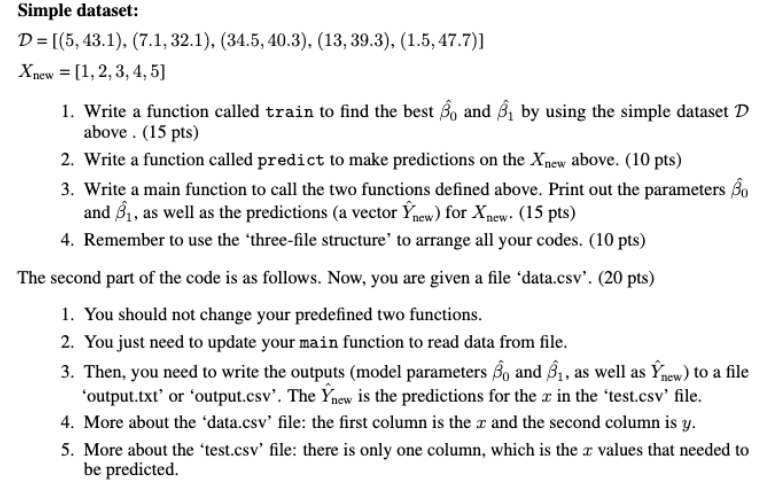
Given a dataset D= {(Ii, yi), i = 1, 2, ...,N} where both X; and yi are scalars. We define the line as y = Bo + B,x. Thus, in order to find the best 'line', we only need to find the best Bo and B, that explain our data well. To calculate the best B1, which is denoted by B1, we use Bi 2 (zi - X)(1 ) (1) -X) where X = avg(X) = and Y = avg(Y) = N =1 Yi (2) N To calculate the best Bo, which is denoted by Bo, we use Bo = Y - X (3) Simple dataset: D = [(5, 43.1), (7.1, 32.1), (34.5, 40.3), (13, 39.3), (1.5, 47.7)] Xnew = [1, 2, 3, 4, 5) 1. Write a function called train to find the best Bo and B, by using the simple dataset D above . (15 pts) 2. Write a function called predict to make predictions on the Xnew above. (10 pts) 3. Write a main function to call the two functions defined above. Print out the parameters Bo and B, as well as the predictions (a vector new) for Xnew. (15 pts) 4. Remember to use the 'three-file structure to arrange all your codes. (10 pts) The second part of the code is as follows. Now, you are given a file 'data.csv'. (20 pts) 1. You should not change your predefined two functions. 2. You just need to update your main function to read data from file. 3. Then, you need to write the outputs (model parameters o and B1, as well as new) to a file output.txt' or 'output.csv'. The new is the predictions for the r in the test.csv' file. 4. More about the data.csv' file: the first column is the r and the second column is y. 5. More about the 'test.csv' file: there is only one column, which is the x values that needed to be predicted. Given a dataset D= {(Ii, yi), i = 1, 2, ...,N} where both X; and yi are scalars. We define the line as y = Bo + B,x. Thus, in order to find the best 'line', we only need to find the best Bo and B, that explain our data well. To calculate the best B1, which is denoted by B1, we use Bi 2 (zi - X)(1 ) (1) -X) where X = avg(X) = and Y = avg(Y) = N =1 Yi (2) N To calculate the best Bo, which is denoted by Bo, we use Bo = Y - X (3) Simple dataset: D = [(5, 43.1), (7.1, 32.1), (34.5, 40.3), (13, 39.3), (1.5, 47.7)] Xnew = [1, 2, 3, 4, 5) 1. Write a function called train to find the best Bo and B, by using the simple dataset D above . (15 pts) 2. Write a function called predict to make predictions on the Xnew above. (10 pts) 3. Write a main function to call the two functions defined above. Print out the parameters Bo and B, as well as the predictions (a vector new) for Xnew. (15 pts) 4. Remember to use the 'three-file structure to arrange all your codes. (10 pts) The second part of the code is as follows. Now, you are given a file 'data.csv'. (20 pts) 1. You should not change your predefined two functions. 2. You just need to update your main function to read data from file. 3. Then, you need to write the outputs (model parameters o and B1, as well as new) to a file output.txt' or 'output.csv'. The new is the predictions for the r in the test.csv' file. 4. More about the data.csv' file: the first column is the r and the second column is y. 5. More about the 'test.csv' file: there is only one column, which is the x values that needed to be predicted
Step by Step Solution
There are 3 Steps involved in it

Get step-by-step solutions from verified subject matter experts