

Question: Given below is the Microsoft Excel output from regressing the Value of cars ($) owned on Salary ($'000), using of particular group of clients in
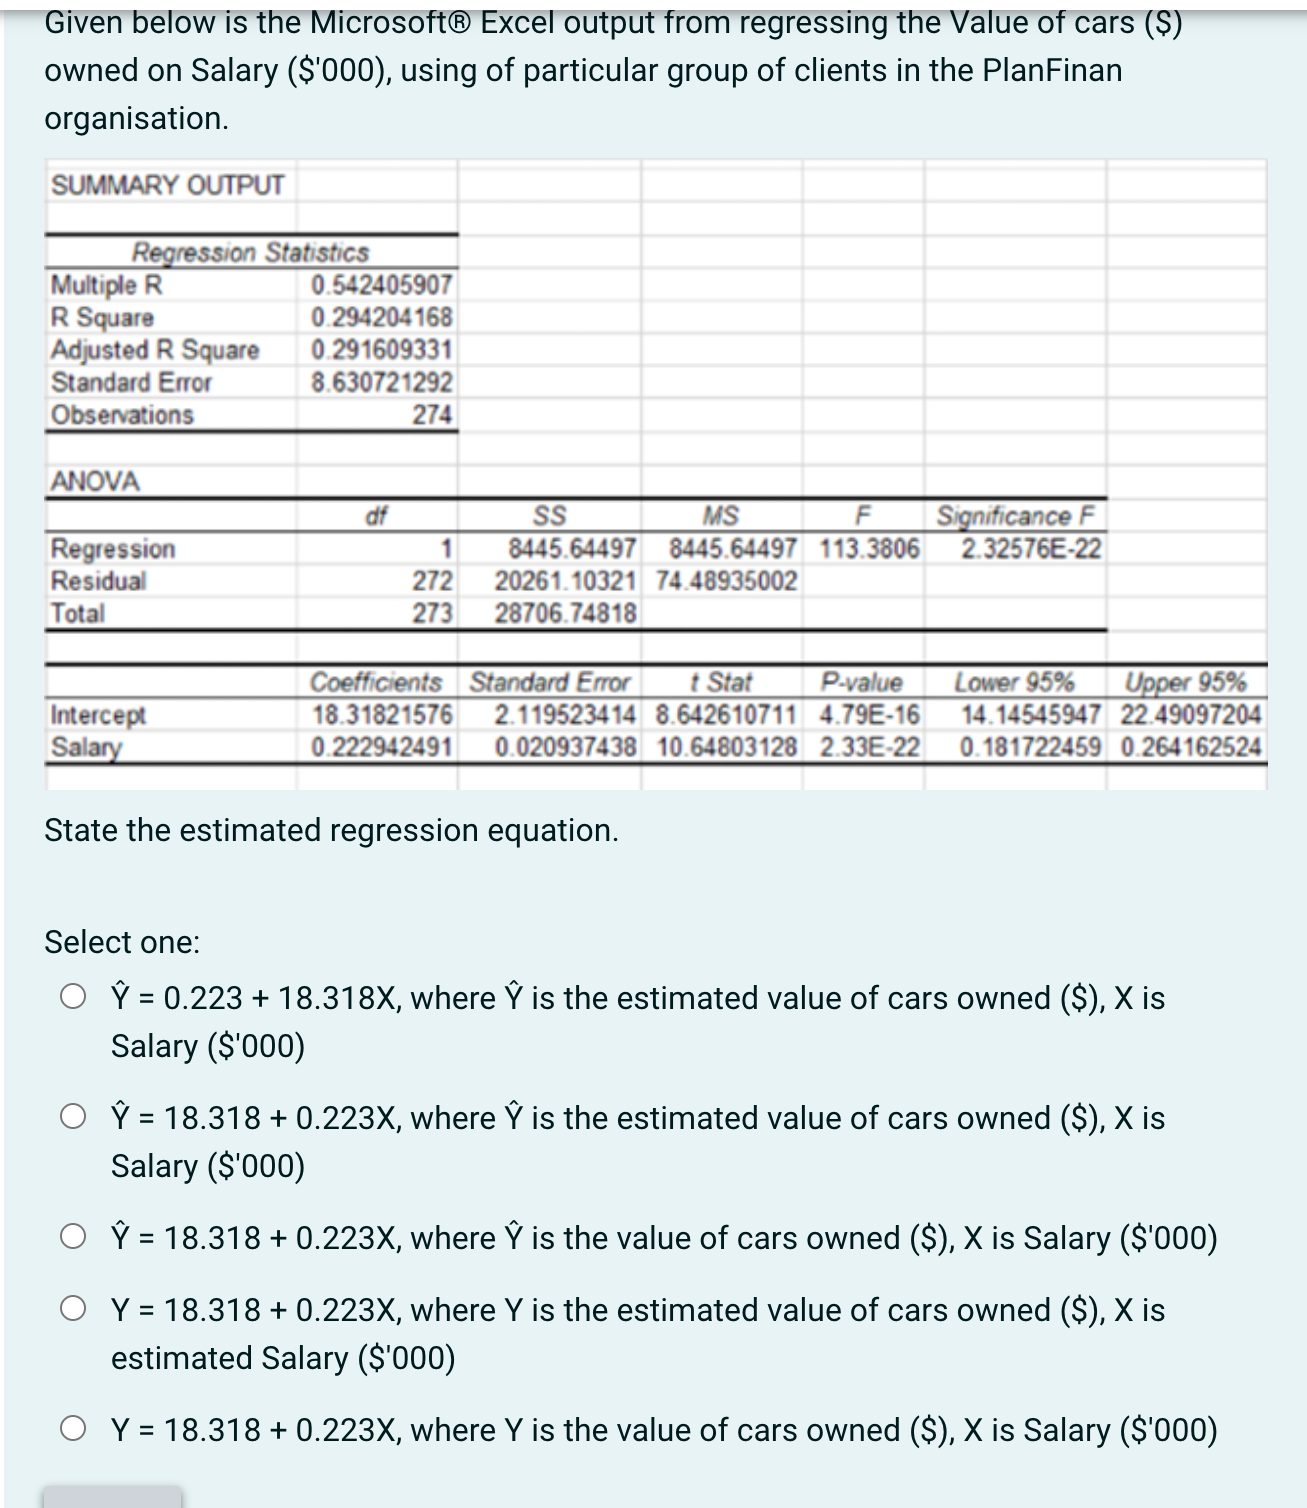
Given below is the Microsoft Excel output from regressing the Value of cars ($) owned on Salary ($'000), using of particular group of clients in the PlanFinan organisation. SUMMARY OUTPUT Regression Statistics Multiple R 0.542405907 R Square 0.294204168 Adjusted R Square 0.291609331 Standard Error 8.630721292 Observations 274 ANOVA df SS MS F Significance F Regression 1 8445.64497 8445.64497 113.3806 2.32576E-22 Residual 272 20261.10321 74.48935002 Total 273 28706.74818 Coefficients Standard Error t Stat P-value Lower 95% Upper 95% Intercept 18.31821576 2.119523414 8.642610711 4.79E-16 14.14545947 22.49097204 Salary 0.222942491 0.020937438 10.64803128 2.33E-22 0.181722459 0.264162524 State the estimated regression equation. Select one: O Y = 0.223 + 18.318X, where Y is the estimated value of cars owned ($), X is Salary ($'000) O Y= 18.318 + 0.223X, where Y is the estimated value of cars owned ($), X is Salary ($'000) O Y = 18.318 + 0.223X, where Y is the value of cars owned ($), X is Salary ($'000) O Y = 18.318 + 0.223X, where Y is the estimated value of cars owned ($), X is estimated Salary ($'000) O Y = 18.318 + 0.223X, where Y is the value of cars owned ($), X is Salary ($'000)
Step by Step Solution
There are 3 Steps involved in it

Get step-by-step solutions from verified subject matter experts