

Question: GIVEN) Compare these groups graphically. How do the groups differ? Does either group show a major departure from Normality? Discuss the other assumptions required for
- GIVEN) Compare these groups graphically. How do the groups differ? Does either group show a major departure from Normality? Discuss the other assumptions required for a t-test. Using Stata to construct side-by-side boxplots: . graph box percentc, over(group) ytitle(Percent Change in Bone Density) title> (Percent Change in Bone Density by Group among n=22 Women, size(default))
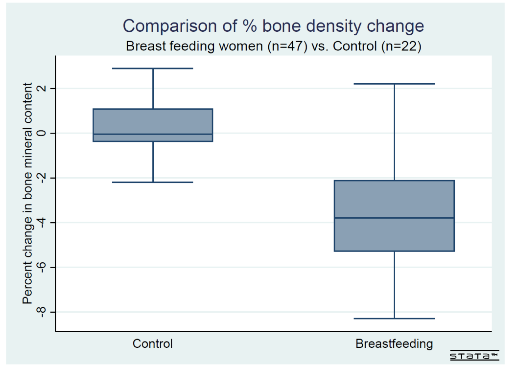
5 4 2 0 2 I l I | | Percent change in bone mineral content -3 I Comparison of % bone density change Breast feeding women ($47] vs. Control (n=22) Control Breastfeeding 5.1313
Step by Step Solution
There are 3 Steps involved in it
1 Expert Approved Answer
Step: 1 Unlock

Question Has Been Solved by an Expert!
Get step-by-step solutions from verified subject matter experts
Step: 2 Unlock
Step: 3 Unlock