

Question: given info: please answer the following: Chapter: Problem: 12 Start with the partial model in the file Ch12 P11 Build a Model.xisx on the textbook's
given info:
please answer the following:
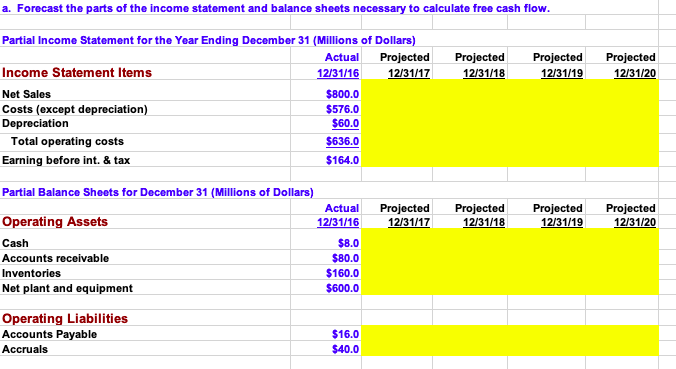
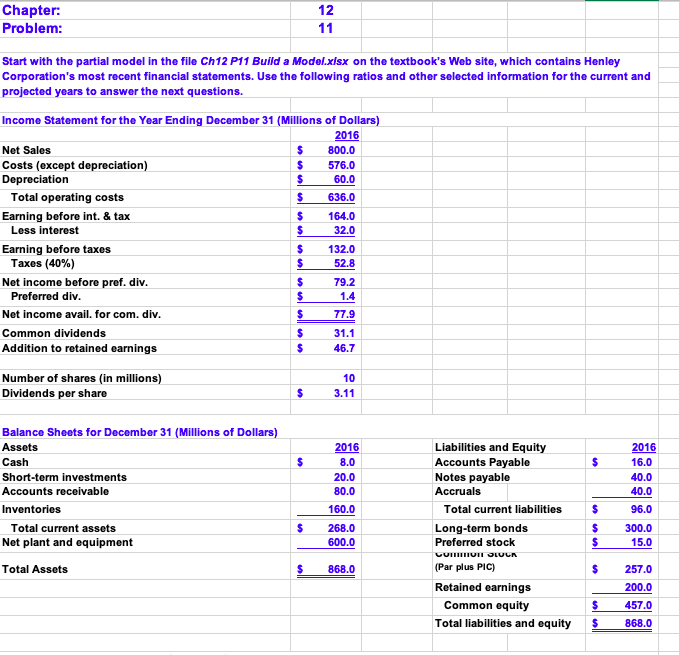
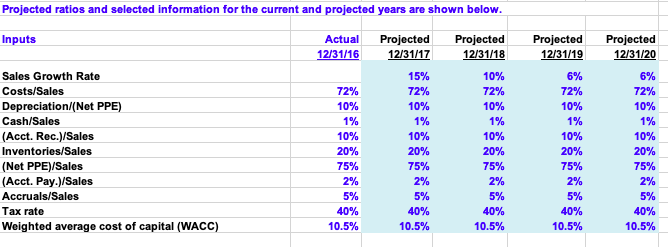
Chapter: Problem: 12 Start with the partial model in the file Ch12 P11 Build a Model.xisx on the textbook's Web site, which contains Henley Corporation's most recent financial statements. Use the following ratios and other selected information for the current and projected years to answer the next questions Income Statement for the Year Ending December 31 (Millions of Dollars) 2016 Net Sales Costs (except depreciation) Depreciation 800.0 S 576.0 60.0 $ 636.0 $164.0 32.0 Total operating costs Earning before int.&tax Less interest Earning before taxes $ 132.0 52.8 79.2 1.4 77.9 31.1 46.7 Taxes (40%) Net income before pref. div Preferred div Net income avail. for com. div Common dividends Addition to retained earnings Number of shares (in millions) Dividends per share 10 3.11 Balance Sheets for December 31 (Millions of Dollars) Assets Cash Short-term investments Accounts receivable Inventories 2016 Liabilities and Equity Accounts Payable Notes payable Accruals 2016 8.0 20.0 80.0 160.0 $ 268.0 600.0 16.0 40.0 40.0 96.0 $ 300.0 15.0 Total current liabilities S Total current assets Net plant and equipment Long-term bonds Preferred stock (Par plus PIC) Retained earnings $868.0 $ 257.0 200.0 $457.0 Total liabilities and equity 868.0 Total Assets Common equity Projected ratios and selected information for the current and projected years are shown below Actual Projected Projected ProjectedProjected Inputs 12/31/20 6% 72% 10% 1% 10% 20% 75% 12/31/19 12/31/1712/31/18 12/3111 10% 72% 10% 1% 10% 20% 75% 6% 72% 10% 1% 10% 20% 75% 15% 72% 10% 1% 10% 20% 75% Sales Growth Rate Costs/Sales Depreciation/(Net PPE) Cash/Sales (Acct. Rec.)/Sales Inventories/Sales (Net PPE)/Sales (Acct. Pay.)/Sales Accruals/Sales Tax rate Weighted average cost of capital (WACC) 10% 1% 10% 75% 10.5% 10.5% 10.5% 10.5% 10.5% a. Forecast the parts of the income statement and balance sheets necessary to calculate free cash flow Partial Income Statement for the Year Ending December 31 (Millions of Dollars) Actual Projected Projected ProjectedProjected 12/31/20 Income Statement Items Net Sales Costs (except depreciation) Depreciation 12/31/17 12/31/18 12/31/19 $800.0 $576.0 $60.0 $636.0 $164.0 Total operating costs Earning before int.&tax Partial Balance Sheets for December 31 (Millions of Dollars) Actual Projected Projected ProjectedProjected 12/31/20 Operating Assets Cash Accounts receivable Inventories Net plant and equipment 12/3111 12/31/17 12/31/18 12/31/19 $8.0 $80.0 $160.0 $600.0 Operating Liabilities Accounts Payable Accruals $16.0 $40.0 Chapter: Problem: 12 Start with the partial model in the file Ch12 P11 Build a Model.xisx on the textbook's Web site, which contains Henley Corporation's most recent financial statements. Use the following ratios and other selected information for the current and projected years to answer the next questions Income Statement for the Year Ending December 31 (Millions of Dollars) 2016 Net Sales Costs (except depreciation) Depreciation 800.0 S 576.0 60.0 $ 636.0 $164.0 32.0 Total operating costs Earning before int.&tax Less interest Earning before taxes $ 132.0 52.8 79.2 1.4 77.9 31.1 46.7 Taxes (40%) Net income before pref. div Preferred div Net income avail. for com. div Common dividends Addition to retained earnings Number of shares (in millions) Dividends per share 10 3.11 Balance Sheets for December 31 (Millions of Dollars) Assets Cash Short-term investments Accounts receivable Inventories 2016 Liabilities and Equity Accounts Payable Notes payable Accruals 2016 8.0 20.0 80.0 160.0 $ 268.0 600.0 16.0 40.0 40.0 96.0 $ 300.0 15.0 Total current liabilities S Total current assets Net plant and equipment Long-term bonds Preferred stock (Par plus PIC) Retained earnings $868.0 $ 257.0 200.0 $457.0 Total liabilities and equity 868.0 Total Assets Common equity Projected ratios and selected information for the current and projected years are shown below Actual Projected Projected ProjectedProjected Inputs 12/31/20 6% 72% 10% 1% 10% 20% 75% 12/31/19 12/31/1712/31/18 12/3111 10% 72% 10% 1% 10% 20% 75% 6% 72% 10% 1% 10% 20% 75% 15% 72% 10% 1% 10% 20% 75% Sales Growth Rate Costs/Sales Depreciation/(Net PPE) Cash/Sales (Acct. Rec.)/Sales Inventories/Sales (Net PPE)/Sales (Acct. Pay.)/Sales Accruals/Sales Tax rate Weighted average cost of capital (WACC) 10% 1% 10% 75% 10.5% 10.5% 10.5% 10.5% 10.5% a. Forecast the parts of the income statement and balance sheets necessary to calculate free cash flow Partial Income Statement for the Year Ending December 31 (Millions of Dollars) Actual Projected Projected ProjectedProjected 12/31/20 Income Statement Items Net Sales Costs (except depreciation) Depreciation 12/31/17 12/31/18 12/31/19 $800.0 $576.0 $60.0 $636.0 $164.0 Total operating costs Earning before int.&tax Partial Balance Sheets for December 31 (Millions of Dollars) Actual Projected Projected ProjectedProjected 12/31/20 Operating Assets Cash Accounts receivable Inventories Net plant and equipment 12/3111 12/31/17 12/31/18 12/31/19 $8.0 $80.0 $160.0 $600.0 Operating Liabilities Accounts Payable Accruals $16.0 $40.0
Step by Step Solution
There are 3 Steps involved in it

Get step-by-step solutions from verified subject matter experts