

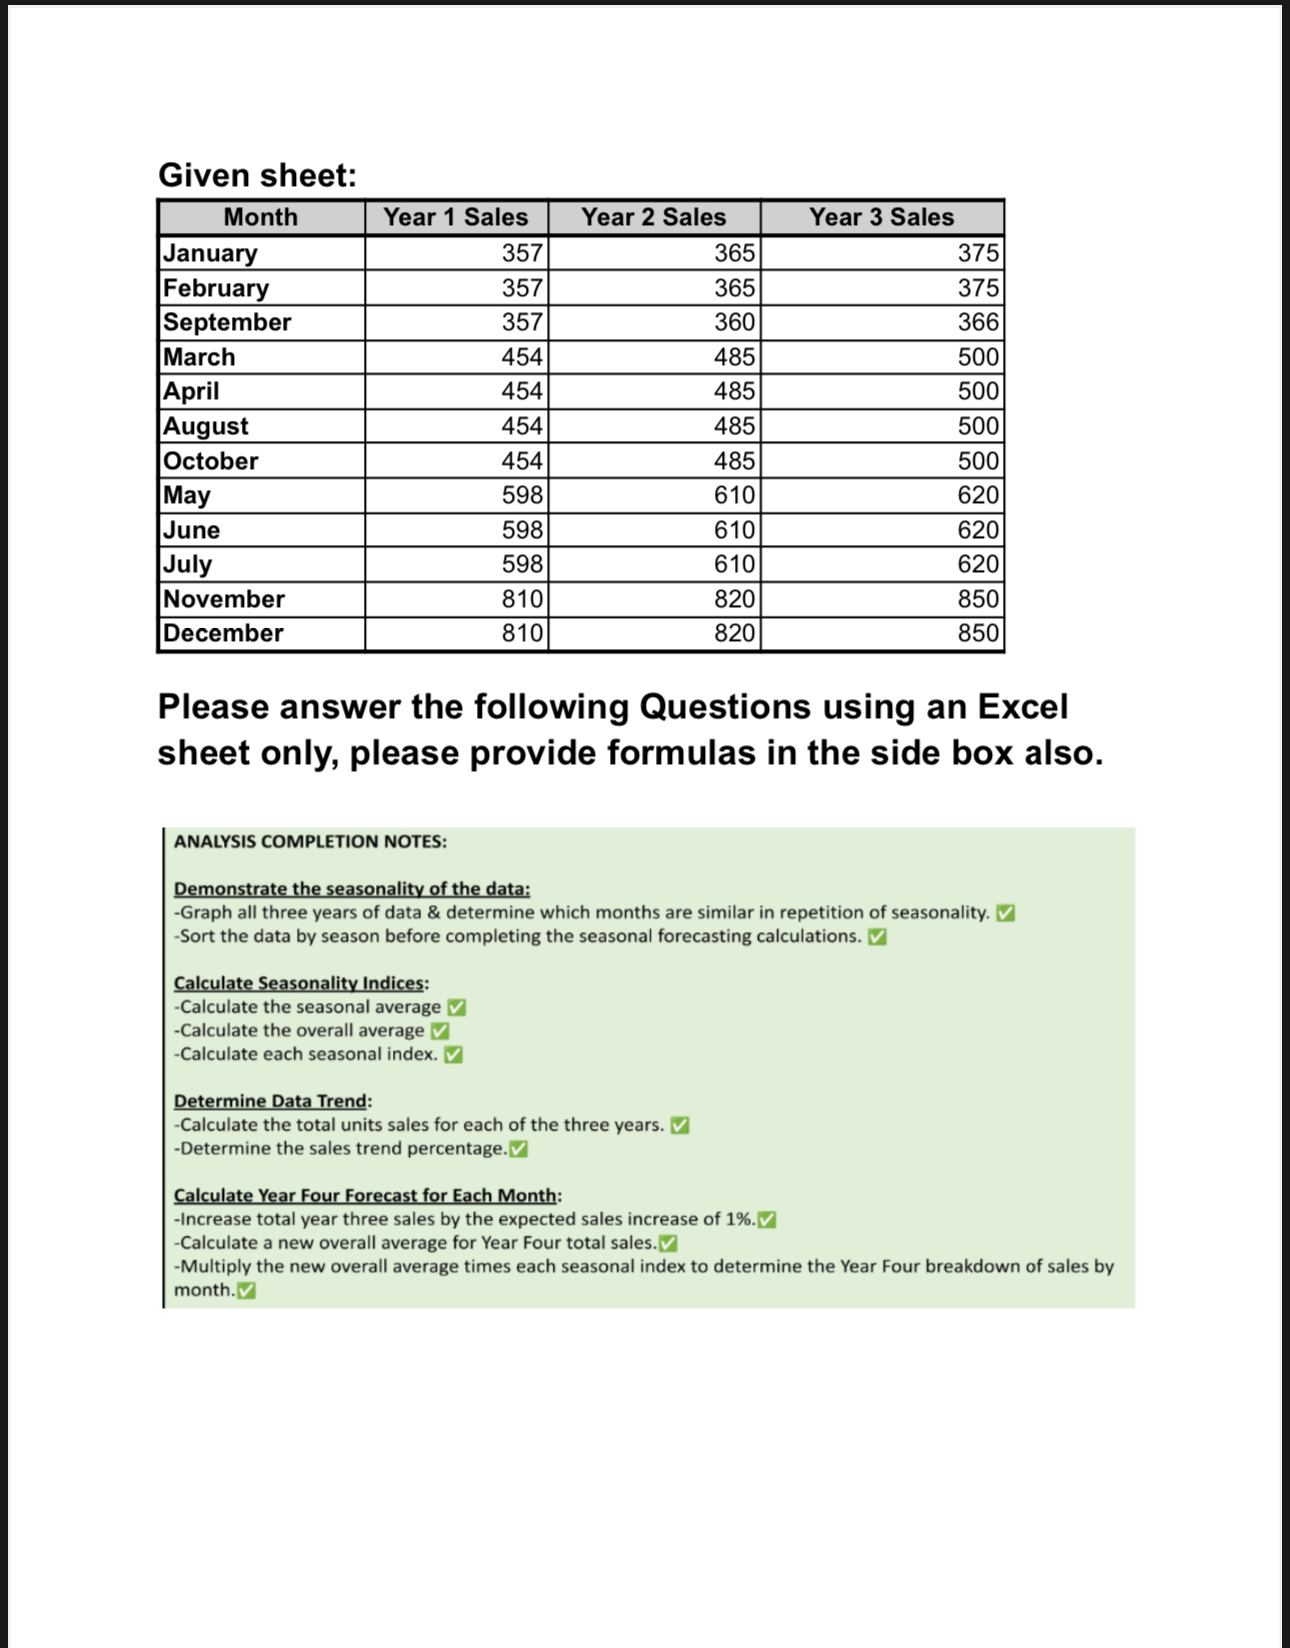
Question: Given sheet: table [ [ Month , Year 1 Sales,Year 2 Sales,Year 3 Sales ] , [ January , 3 5 7 , 3
Given sheet:
tableMonthYear Sales,Year Sales,Year SalesJanuaryFebruarySeptemberMarchAprilAugustOctoberMayJuneJulyNovemberDecember
Please answer the following Questions using an Excel sheet only, please provide formulas in the side box also.
ANALYSIS COMPLETION NOTES:
Demonstrate the seasonality of the data:
Graph all three years of data & determine which months are similar in repetition of seasonality.
Sort the data by season before completing the seasonal forecasting calculations.
Calculate Seasonality Indices:
Calculate the seasonal average
Calculate the overall average
Calculate each seasonal index.
Determine Data Trend:
Calculate the total units sales for each of the three years.
Determine the sales trend percentage.
Calculate Year Four Forecast for Each Month:
Increase total year three sales by the expected sales increase of
Calculate a new overall average for Year Four total sales.
Multiply the new overall average times each seasonal index to determine the Year Four breakdown of sales by month.
Step by Step Solution
There are 3 Steps involved in it
1 Expert Approved Answer
Step: 1 Unlock

Question Has Been Solved by an Expert!
Get step-by-step solutions from verified subject matter experts
Step: 2 Unlock
Step: 3 Unlock