

Question: Given the above graph, what would be produced at points A, B and C? What is the basic principle that the production possibility curve illustrates?
- Given the above graph, what would be produced at points A, B and C?
- What is the basic principle that the production possibility curve illustrates?
- What does a point inside the production possibility curve illustrate?
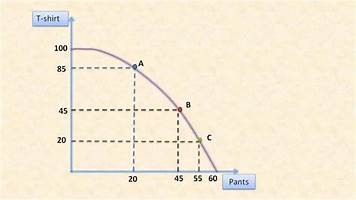
T-shirt 100 85 45 20 20 20 45 55 60 Pants
Step by Step Solution
There are 3 Steps involved in it
1 Expert Approved Answer
Step: 1 Unlock

Question Has Been Solved by an Expert!
Get step-by-step solutions from verified subject matter experts
Step: 2 Unlock
Step: 3 Unlock