

Question: Given the accompanying data, use Excel's function options to find MAD, the sample variance, and the sample standard deviation. begin{tabular}{|c|c|c|c|c|c|c|c|c|} hline 4 & A &
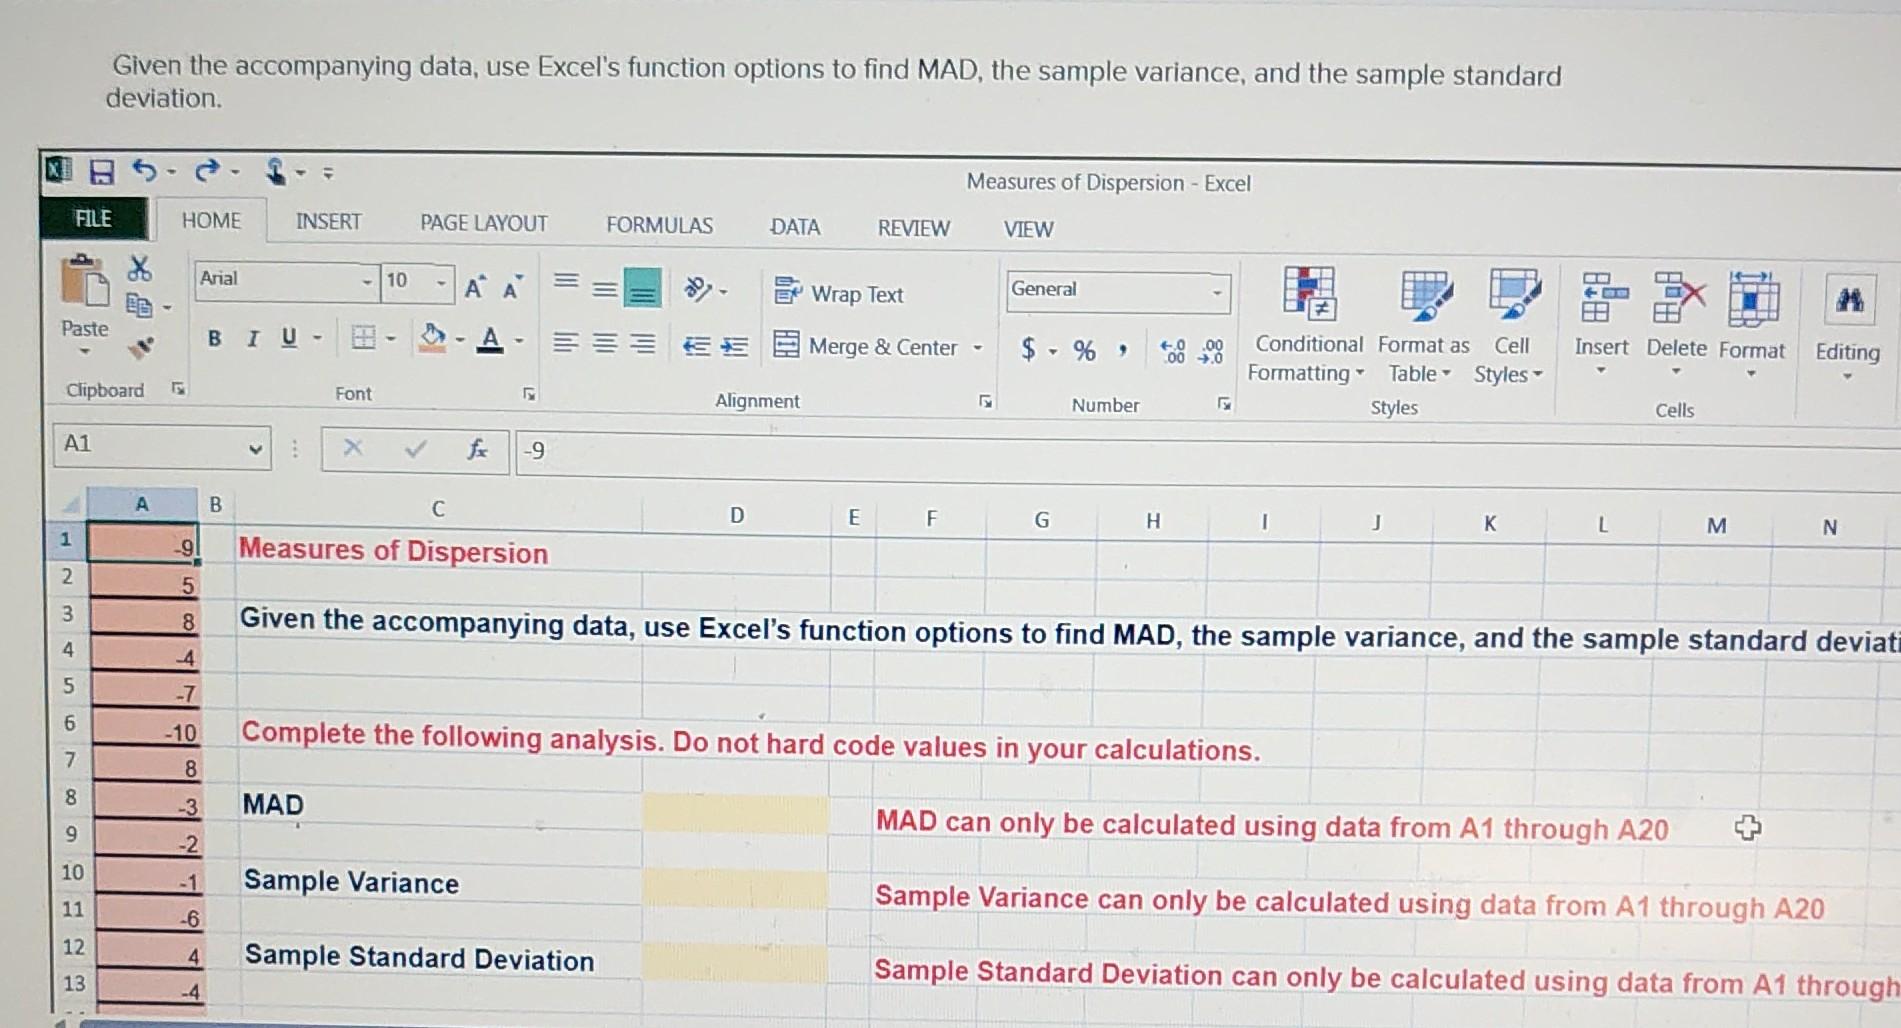
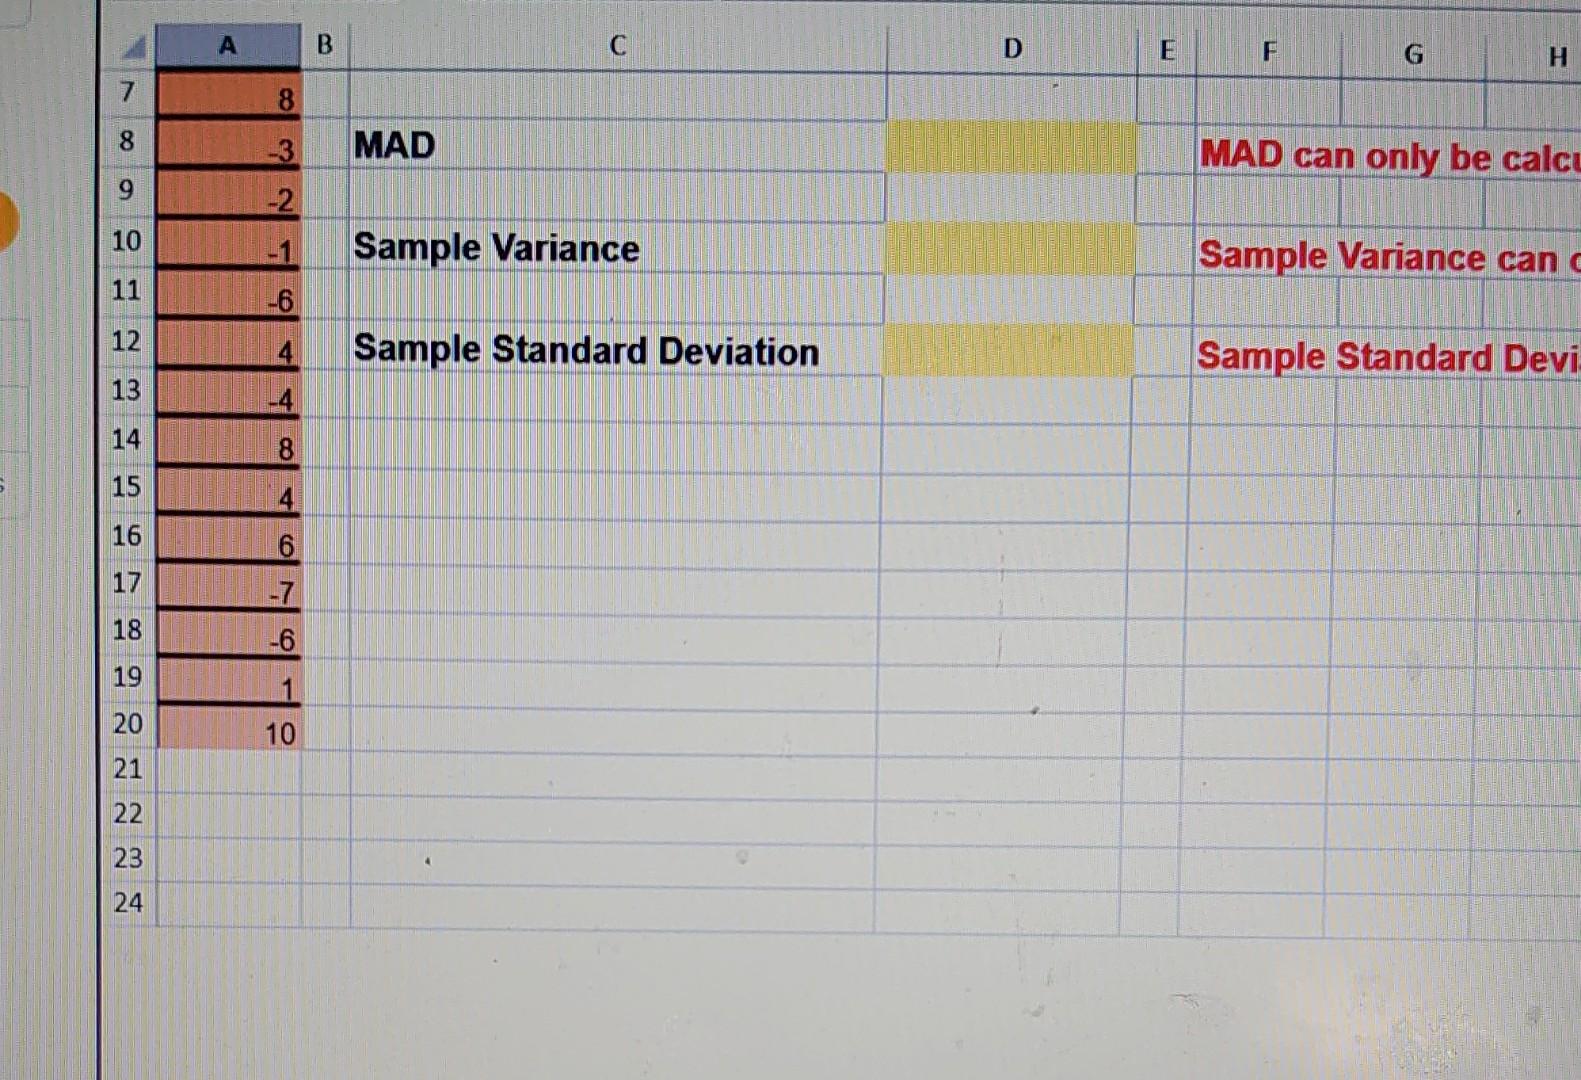
Given the accompanying data, use Excel's function options to find MAD, the sample variance, and the sample standard deviation. \begin{tabular}{|c|c|c|c|c|c|c|c|c|} \hline 4 & A & 3 & C & D & E & F & G & H \\ \hline 7 & 8 & & & & & & & \\ \hline 8 & -3 & & MAD & & & \multicolumn{3}{|c|}{ MAD can only be calci } \\ \hline 9 & -2 & & & & & & & \\ \hline 10 & -1 & \multicolumn{2}{|r|}{ Sample Variance } & & & \multicolumn{3}{|c|}{ Sample Variance can } \\ \hline 11 & -6 & & & & & & & \\ \hline 12 & 4. & \multicolumn{2}{|r|}{ Sample Standard Deviation } & & & \multicolumn{3}{|c|}{ Sample Standard Devi } \\ \hline 13 & -4 & & & & & & & \\ \hline 14 & 8 & & & & & & & \\ \hline 15 & 4 & & & & & & & \\ \hline 16 & 6 & & & & & & & \\ \hline 17 & -7 & & & & & & & \\ \hline 18 & -6 & & & & & & & \\ \hline 19 & 1 & & & & & & & \\ \hline 20 & 10 & & & & & & & \\ \hline 21 & & & & & & & & \\ \hline 22 & & & & & & & & \\ \hline 23 & & & \% & & & & & \\ \hline 24 & & & & & & & & \\ \hline \end{tabular}
Step by Step Solution
There are 3 Steps involved in it

Get step-by-step solutions from verified subject matter experts