

Question: Given the below sensitivity analysis table for a cost minimization SENSITIVITY ANALYSIS TABLE table [ [ Variable , Solution,Origin,I Value, table [ [
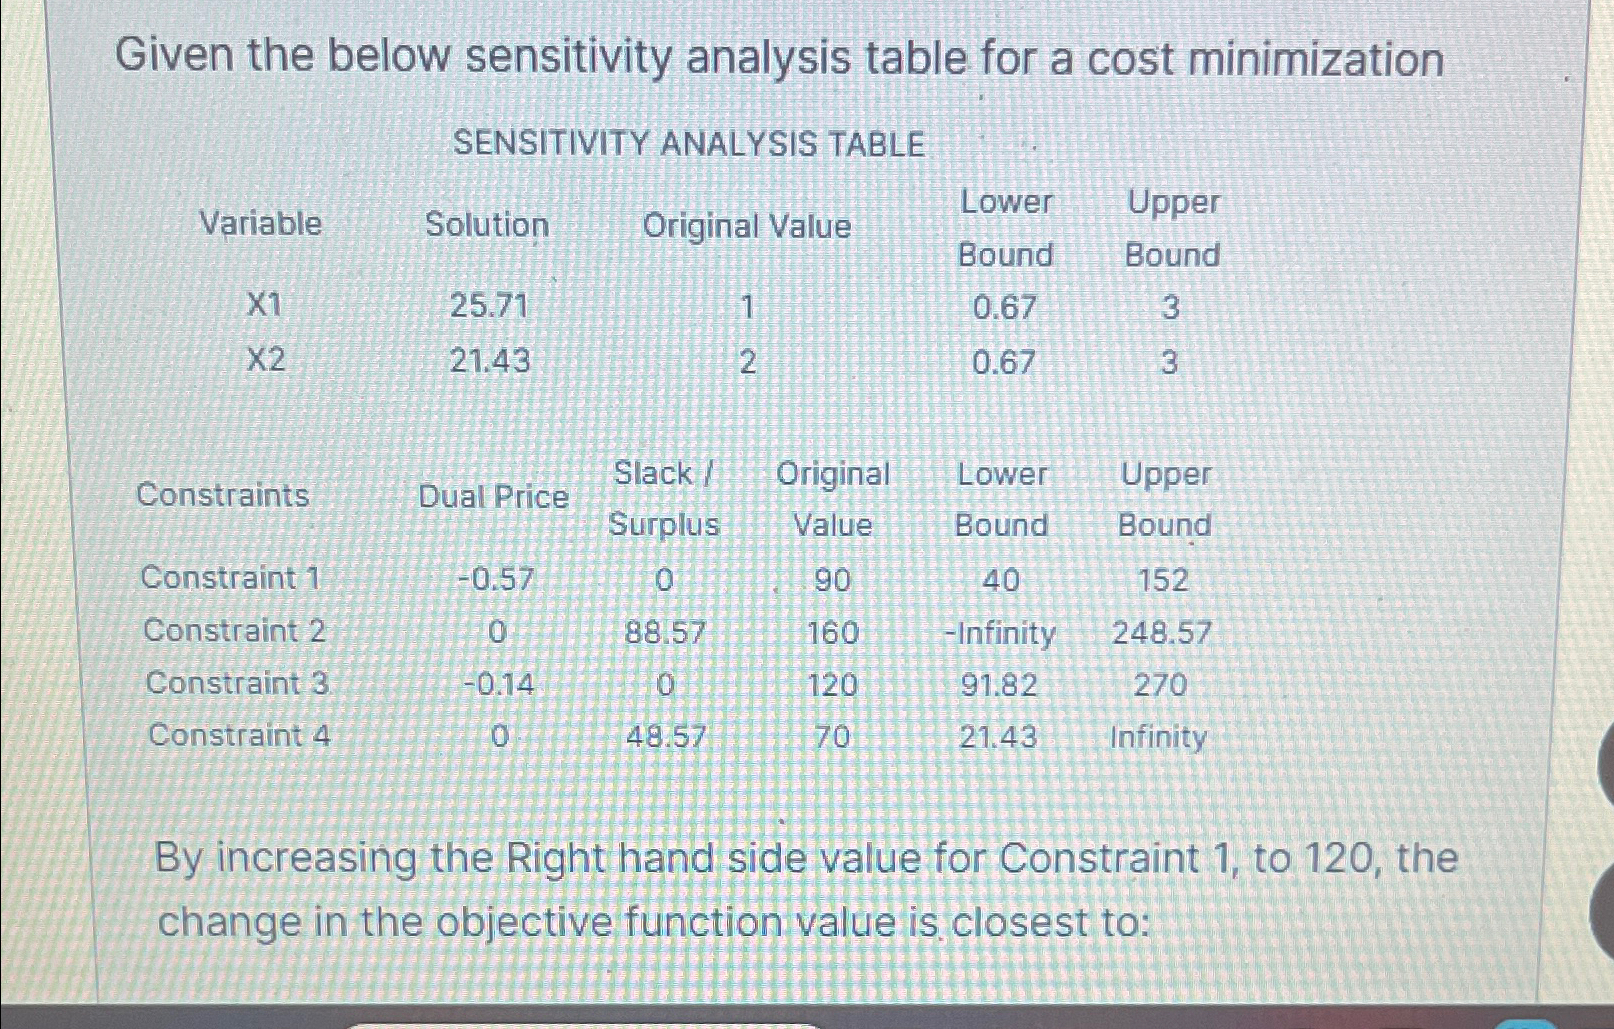
Given the below sensitivity analysis table for a cost minimization
SENSITIVITY ANALYSIS TABLE
tableVariableSolution,Origin,I Value,tableLowerBoundtableUpperBoundConstraintsDual Price,tableSlack SurplustableOriginalValuetableLowerBoundtableUpperBoundConstraint Constraint Infinity,Constraint Constraint Infinity
By increasing the Right hand side value for Constraint to the change in the objective function value is closest to:
Step by Step Solution
There are 3 Steps involved in it
1 Expert Approved Answer
Step: 1 Unlock

Question Has Been Solved by an Expert!
Get step-by-step solutions from verified subject matter experts
Step: 2 Unlock
Step: 3 Unlock