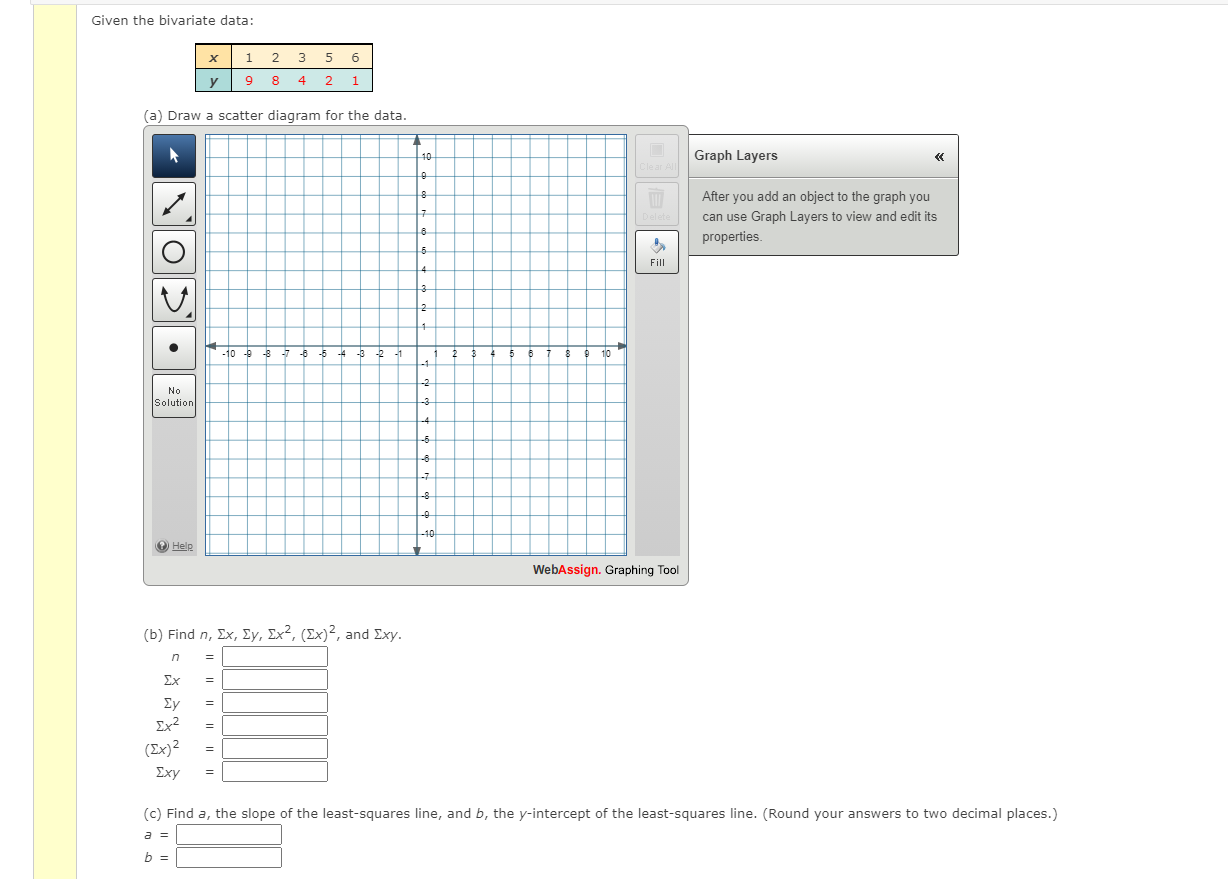
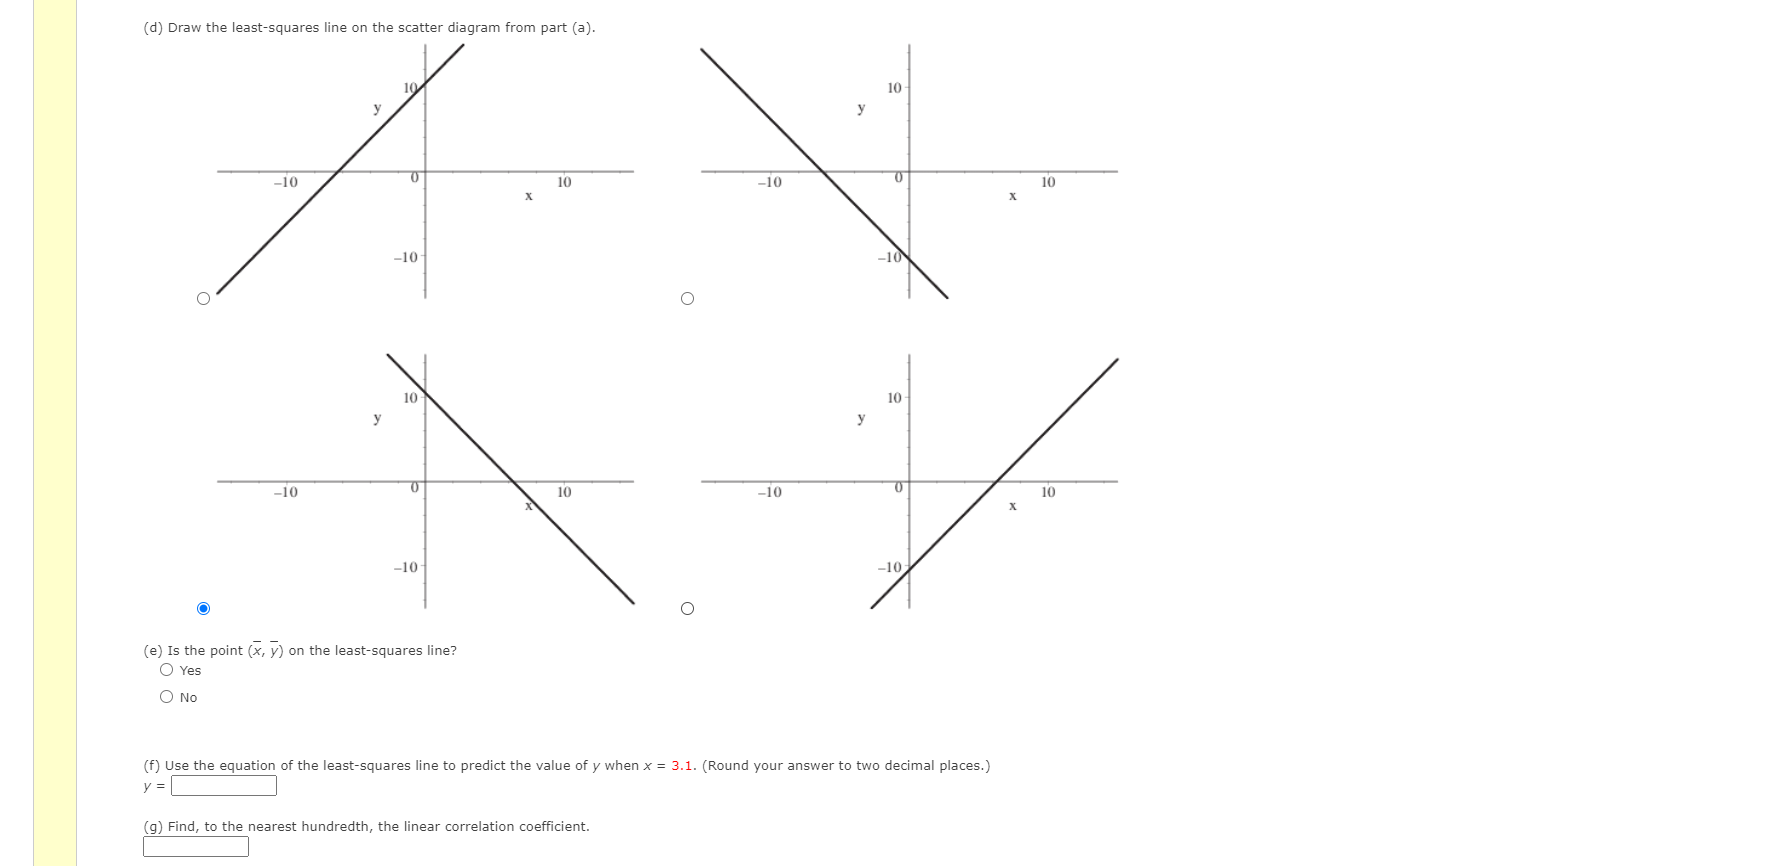
Question: Given the bivariate data: X 1 2 3 5 6 y 9 8 4 2 1 (a) Draw a scatter diagram for the data. Graph

Given the bivariate data: X 1 2 3 5 6 y 9 8 4 2 1Given the bivariate data: X 1 2 3 5 6 y 9 8 4 2 1
Given the bivariate data: X 1 2 3 5 6 y 9 8 4 2 1 (a) Draw a scatter diagram for the data. Graph Layers After you add an object to the graph you can use Graph Layers to view and edit its properties. O Fill . -10 - -8 -7 -6 -5 4 -3 -2 -1 5 10 No Solution Help WebAssign. Graphing Tool (b) Find n, Ex, Ey, Ex2, (Ex) 2, and Exy. n = Ex Ey Ex2 11 11 1 1I (Ex) 2 Exy (c) Find a, the slope of the least-squares line, and b, the y-intercept of the least-squares line. (Round your answers to two decimal places.) a : b =(d) Draw the least-squares line on the scatter diagram from part (a). 10 10 y -10 0 10 X -10 10 -10 X O -10 O 10 10 y -10 0 10 -10 0 10 -10 X O -10 Yes (e) Is the point (x, y) on the least-squares line? O O No y = (f) Use the equation of the least-squares line to predict the value of y when x = 3.1. (Round your answer to two decimal places.) (g) Find, to the nearest hundredth, the linear correlation coefficient

Step by Step Solution

There are 3 Steps involved in it

1 Expert Approved Answer
Step: 1 Unlock blur-text-image
Question Has Been Solved by an Expert!

Get step-by-step solutions from verified subject matter experts

Step: 2 Unlock
Step: 3 Unlock

Students Have Also Explored These Related Mathematics Questions!