

Question: Given the data as shown in the table below a) Assuming the correlation coefcient of X and Y 1s found to be 0. 897995, calculate
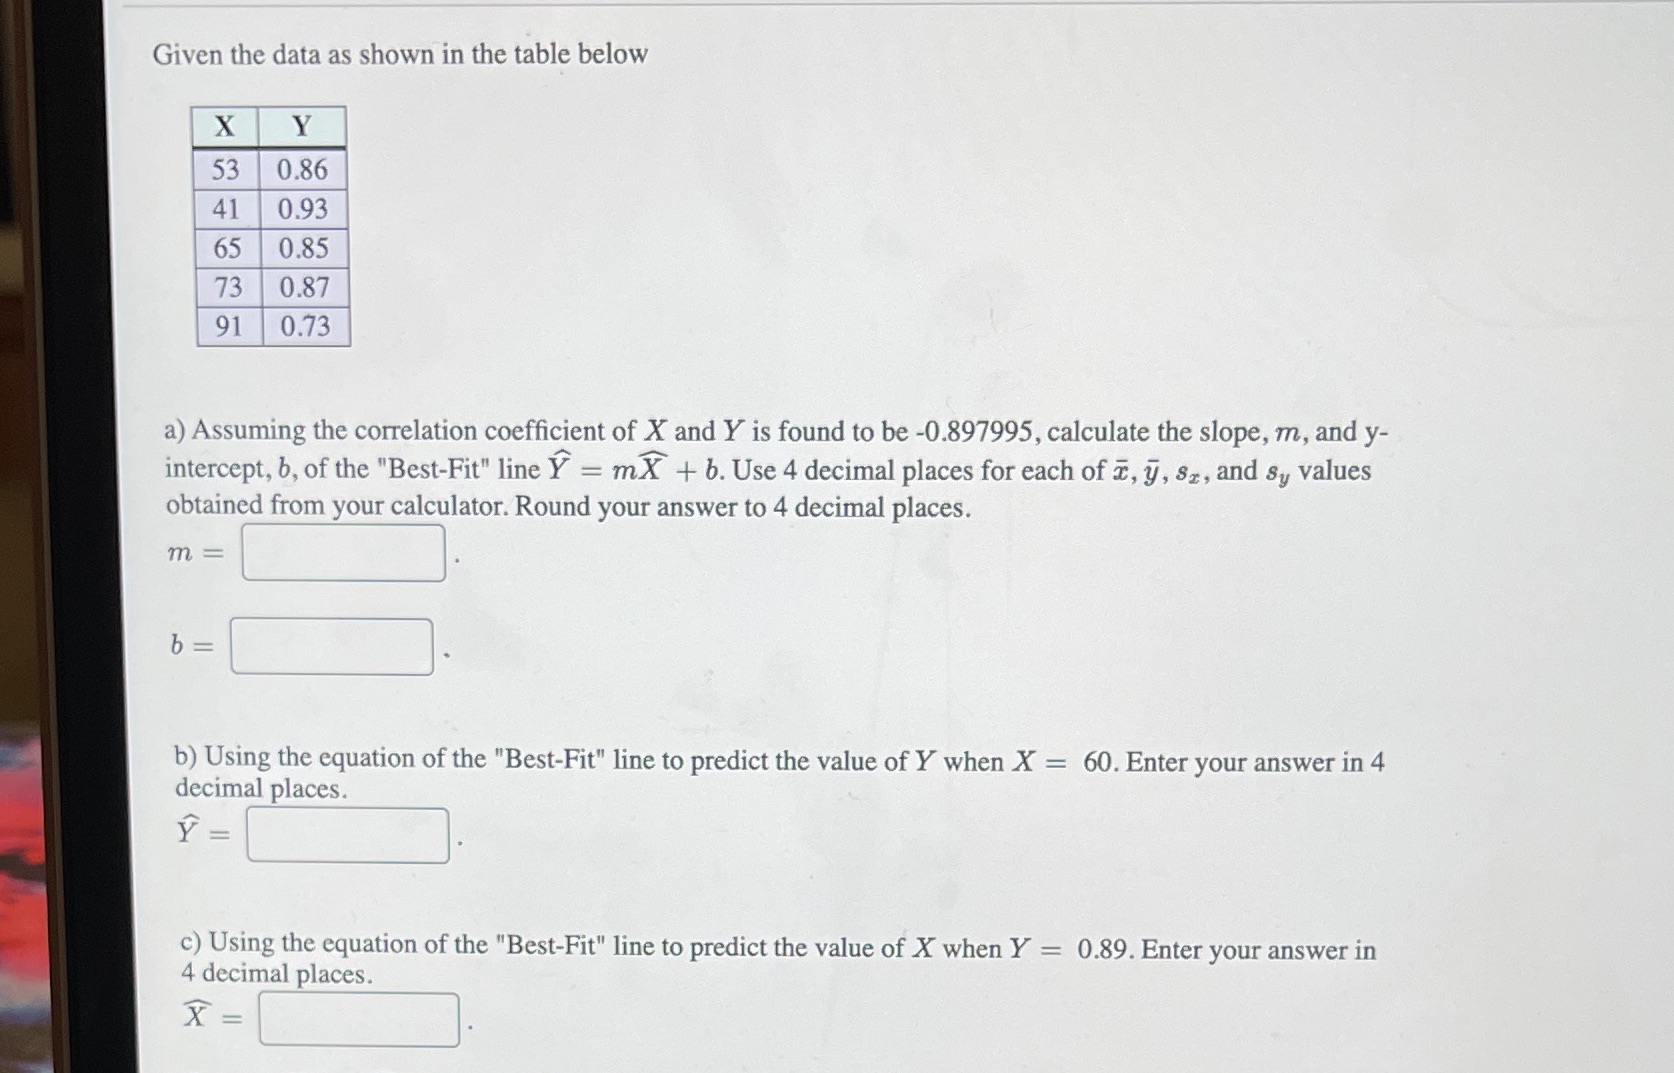
Given the data as shown in the table below a) Assuming the correlation coefcient of X and Y 1s found to be 0. 897995, calculate the slope, m, and y- intercept b, of the "Best-Fit" line Y: mX + I). Use 4 decimal places for each of x y, 3,, and 3,, values obtained from your calculator Round your answer to 4 decimal places. 13) Using the equation of the "Best-Fit" line to predict the value of Y when X: 60. Enter your answer in 4 decimal places. c) Using the equation of the "Best-Fit" line to predict the value of X when Y 0 .89 Enter your answer .in 4 decimal places
Step by Step Solution
There are 3 Steps involved in it
1 Expert Approved Answer
Step: 1 Unlock

Question Has Been Solved by an Expert!
Get step-by-step solutions from verified subject matter experts
Step: 2 Unlock
Step: 3 Unlock