

Question: 1234 Given the data table below (values and uncertainties in F and G) and the algorithms relating F and G to x and y
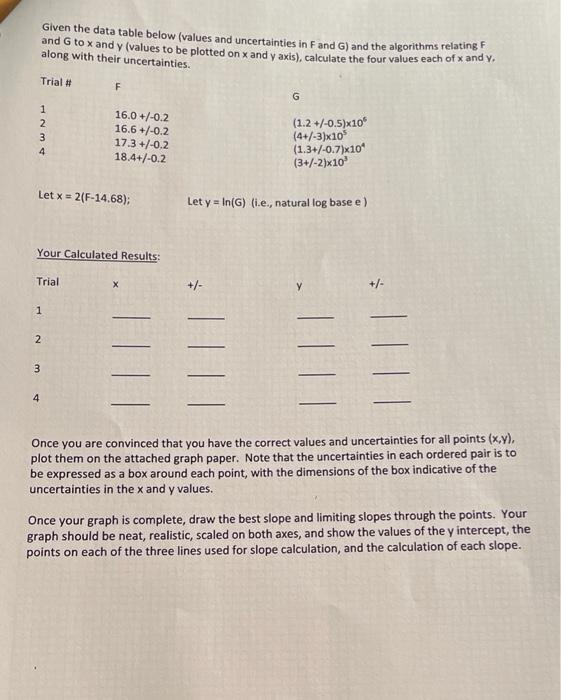
1234 Given the data table below (values and uncertainties in F and G) and the algorithms relating F and G to x and y (values to be plotted on x and y axis), calculate the four values each of x and y. along with their uncertainties. Trial # Let x = 2(F-14.68); Trial Your Calculated Results: 1 2 3 F 4 16.0 +/-0.2 16.6 +/-0.2 17.3 +/-0.2 18.4+/-0.2 G +/- (1.2 +/-0.5)x10 (4+/-3)x10 (1.3+/-0.7)x10* (3+/-2)x10 Let y = In(G) (i.e., natural log base e ) +/- Once you are convinced that you have the correct values and uncertainties for all points (x,y), plot them on the attached graph paper. Note that the uncertainties in each ordered pair is to be expressed as a box around each point, with the dimensions of the box indicative of the uncertainties in the x and y values. Once your graph is complete, draw the best slope and limiting slopes through the points. Your graph should be neat, realistic, scaled on both axes, and show the values of the y intercept, the points on each of the three lines used for slope calculation, and the calculation of each slope.
Step by Step Solution
3.49 Rating (162 Votes )
There are 3 Steps involved in it

Get step-by-step solutions from verified subject matter experts