

Question: Given the data use least-squares regression to fit (a) a straight line, (b) a power equation, (c) a saturation-growth-rate equation, and (d) a parabola. For
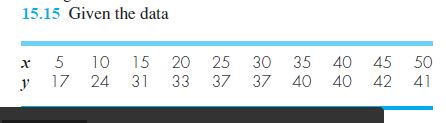
Given the data
use least-squares regression to fit (a) a straight line, (b) a power equation, (c) a saturation-growth-rate equation, and (d) a parabola. For (b) and (c), employ transformations to linearize the data. Plot the data along with all the curves. Is any one of the curves superior? If so, justify.
Thanks for the help in advance !
15.15 Given the data r 5 10 15 20 25 30 35 40 45 50 y 17 24 31 33 37 37 40 40 42 41
Step by Step Solution
There are 3 Steps involved in it
1 Expert Approved Answer
Step: 1 Unlock

Question Has Been Solved by an Expert!
Get step-by-step solutions from verified subject matter experts
Step: 2 Unlock
Step: 3 Unlock