

Question: ion Consider the given data. O ON 2 6 4 7 y 5 6 9 69 0 00 11 8 12 8 15 10 17
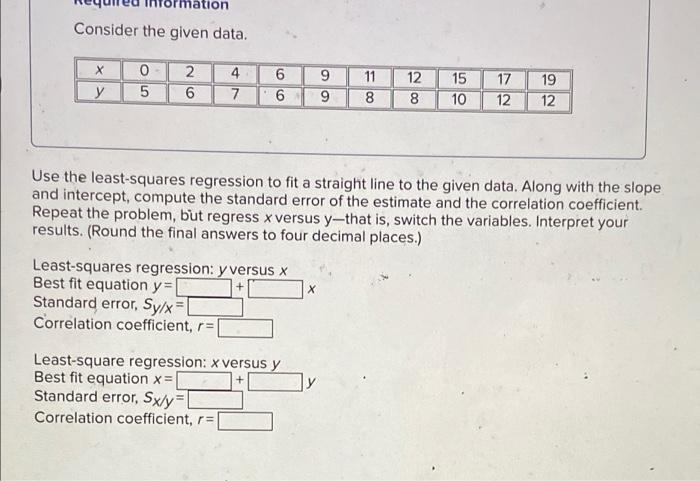
ion Consider the given data. O ON 2 6 4 7 y 5 6 9 69 0 00 11 8 12 8 15 10 17 12 19 12 00 N Use the least-squares regression to fit a straight line to the given data. Along with the slope and intercept, compute the standard error of the estimate and the correlation coefficient. Repeat the problem, but regress x versus y-that is, switch the variables. Interpret your results. (Round the final answers to four decimal places.) Least-squares regression: y versus x Best fit equation ya Standard error, Sy/x- Correlation coefficient, r= X Least-square regression: x versus y Best fit equation x = Standard error, Sx/y = Correlation coefficient, r=
Step by Step Solution
There are 3 Steps involved in it

Get step-by-step solutions from verified subject matter experts