

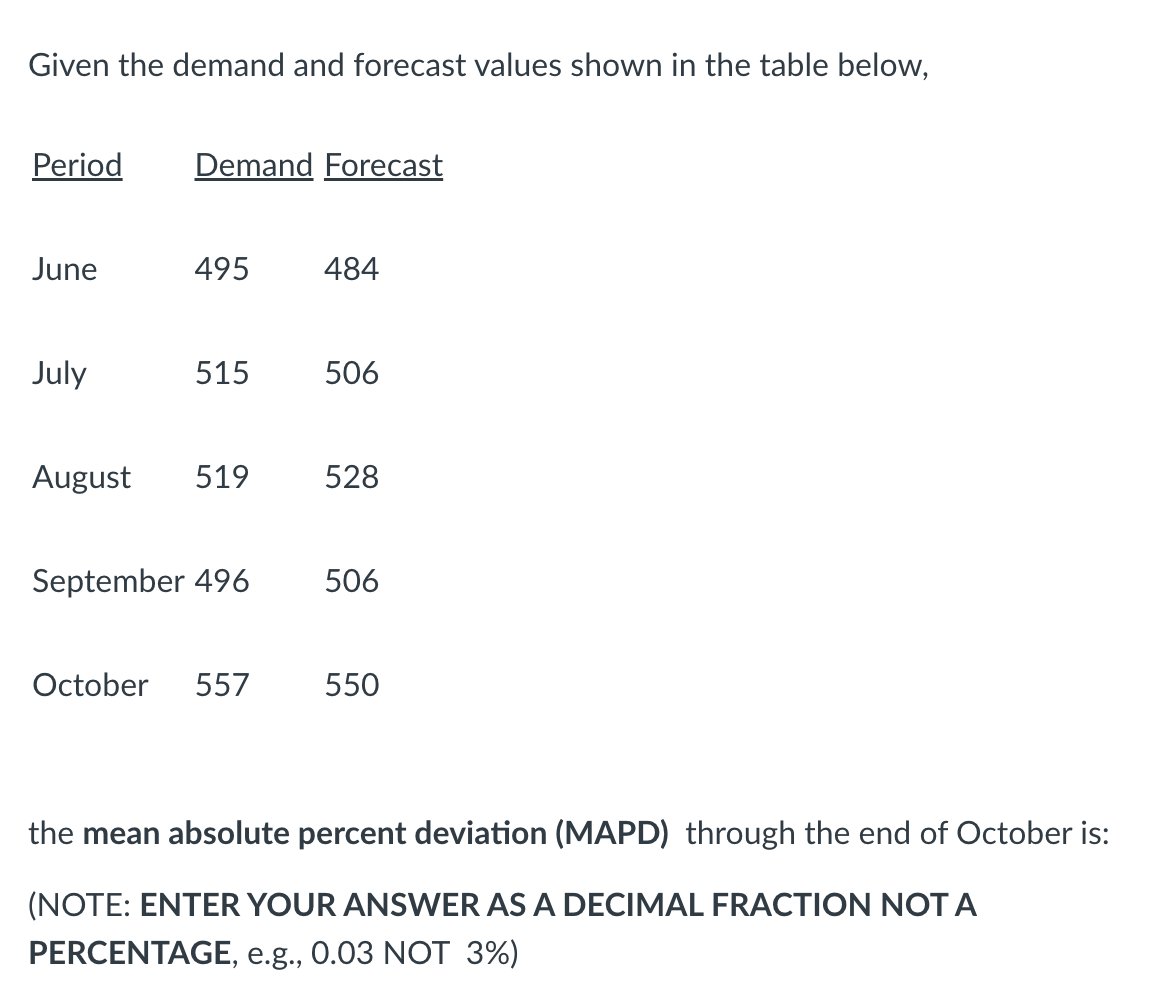
Question: Given the demand and forecast values shown in the table below, the mean absolute percent deviation (MAPD) through the end of October is: (NOTE: ENTER
Step by Step Solution
There are 3 Steps involved in it
1 Expert Approved Answer
Step: 1 Unlock

Question Has Been Solved by an Expert!
Get step-by-step solutions from verified subject matter experts
Step: 2 Unlock
Step: 3 Unlock