

Question: Given the following box plot: Figure2.41 which quarter has the smallest spread of data? What is that spread? which quarter has the largest spread of
Given the following box plot:
Figure2.41
- which quarter has the smallest spread of data? What is that spread?
- which quarter has the largest spread of data? What is that spread?
- find the interquartile range (IQR).
- are there more data in the interval 5-10 or in the interval 10-13? How do you know this?
- which interval has the fewest data in it? How do you know this?
- 0-2
- 2-4
- 10-12
- 12-13
- need more information
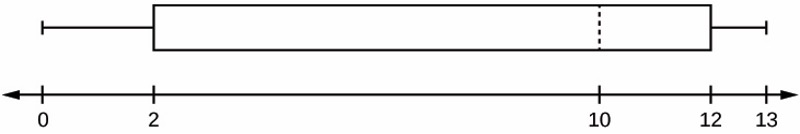
0 2 10 12 13
Step by Step Solution
There are 3 Steps involved in it
1 Expert Approved Answer
Step: 1 Unlock

Question Has Been Solved by an Expert!
Get step-by-step solutions from verified subject matter experts
Step: 2 Unlock
Step: 3 Unlock