

Question: Given the following project network, baseline, and status information, develop status reports for periods 2, 4, 6, 8 and and complete the performance indexes table.
Given the following project network, baseline, and status information, develop status reports for periods 2, 4, 6, 8 and and complete the performance indexes table. Calculate the EACf and the VACf.
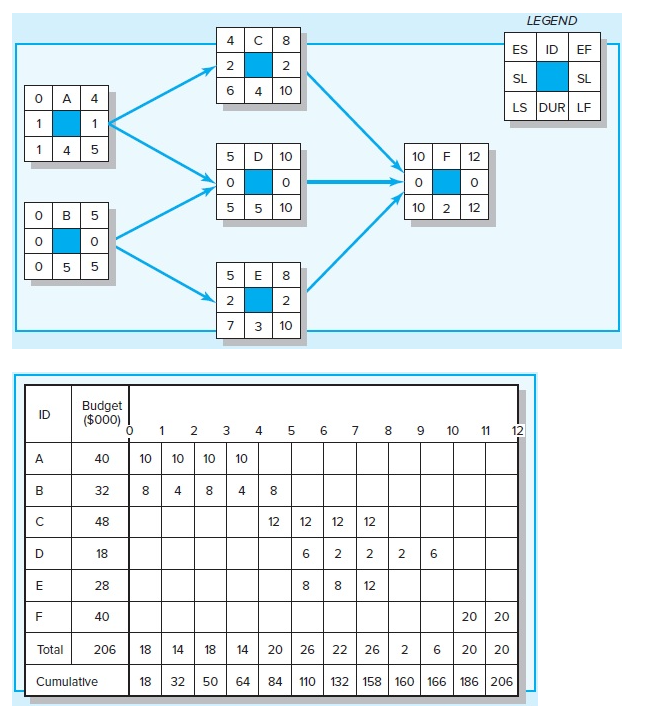
(Do not round intermediate calculations. Enter all answers to 2 decimal precision. Enter PCI-B in percent format (e.g., enter 73.05% if the decimal equivalent is 0.7305.)
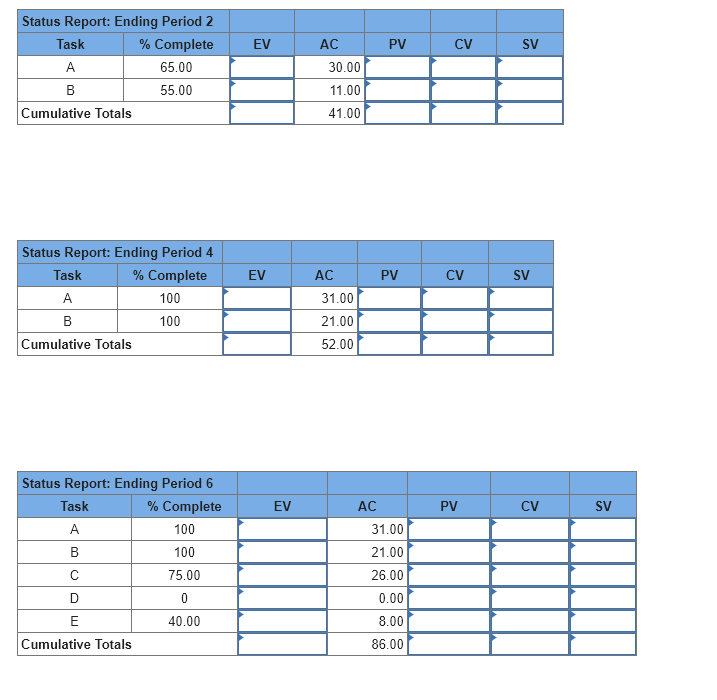
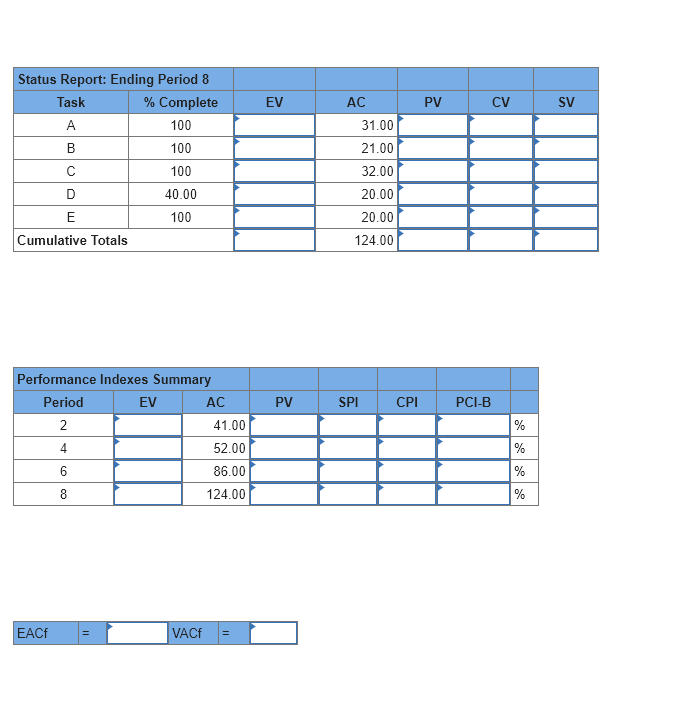
\begin{tabular}{|c|c|c|c|c|c|} \hline 4 & C & 8 \\ \hline 0 & A & 4 \\ \hline 1 & & 1 \\ \hline 1 & 4 & 5 \\ \hline 0 & & 2 \\ \hline 0 & B & 5 \\ \hline 0 & & 0 \\ \hline 0 & 5 & 5 \\ \hline \end{tabular}\begin{tabular}{|c|c|c|} \hline 5 & D & 10 \\ \hline 0 & & 0 \\ \hline \end{tabular} LEGEND \begin{tabular}{|c|c|c|} \hline 5 & D & 10 \\ \hline 0 & & 0 \\ \hline 5 & 5 & 10 \\ \hline \end{tabular} \begin{tabular}{|c|c|c|} \hline ES & ID & EF \\ \hline SL & & SL \\ \hline LS & DUR & LF \\ \hline \end{tabular} \begin{tabular}{|c|c|c|c|c|c|c|c|} \hline \multicolumn{2}{|l|}{ Status Report: Ending Period 2 } & & & & & \\ \hline Task & \% Complete & EV & AC & PV & CV & SV \\ \hline A & 65.00 & & 30.00 & & & \\ \hline B & 55.00 & & 11.00 & & & \\ \hline Cumulative Totals & & 41.00 & & & \\ \hline \end{tabular} \begin{tabular}{|c|c|c|c|c|c|c|} \hline \multicolumn{2}{|c|}{ Status Report: Ending Period 4 } & & & & & \\ \hline Task & \% Complete & EV & AC & PV & CV & SV \\ \hline A & 100 & & 31.00 & & & \\ \hline B & 100 & & 21.00 & & & \\ \hline \multicolumn{2}{|c|}{ Cumulative Totals } & & 52.00 & & & \\ \hline \end{tabular} \begin{tabular}{|c|c|c|c|c|c|c|} \hline \multicolumn{2}{|c|}{ Status Report: Ending Period 6 } & & & & & \\ \hline Task & \% Complete & EV & AC & PV & CV & SV \\ \hline A & 100 & & 31.00 & & & \\ \hline B & 100 & & 21.00 & & & \\ \hline C & 75.00 & & 26.00 & & & \\ \hline D & 0 & & 0.00 & & & \\ \hline E & 40.00 & & 8.00 & & & \\ \hline Cumulative Totals & & & 86.00 & & \\ \hline \end{tabular} \begin{tabular}{|r|l|l|l|} \hline AC & PV & CV & SV \\ \hline 31.00 & & & \\ \hline 21.00 & & & \\ \hline 32.00 & & & \\ \hline 20.00 & & & \\ \hline 20.00 & & & \\ \hline 124.00 & & & \\ \hline \end{tabular} \begin{tabular}{|c|c|c|c|c|c|c|c|} \hline \multicolumn{2}{|l|}{ Performance Indexes Summary } & & & & & \\ \hline Period & EV & AC & PV & SPI & CPI & PCI-B & \\ \hline 2 & & 41.00 & & & & & % \\ \hline 4 & & 52.00 & & & & & % \\ \hline 6 & & 86.00 & & & & & % \\ \hline 8 & & 124.00 & & & & & % \\ \hline \end{tabular} EACf=VACf=
Step by Step Solution
There are 3 Steps involved in it

Get step-by-step solutions from verified subject matter experts