

Question: Given the following range chart, what can be concluded? Group of answer choices The process is capable The process is not capable The process is
Given the following range chart, what can be concluded?
Group of answer choices
The process is capable
The process is not capable
The process is in control
The process is out of control
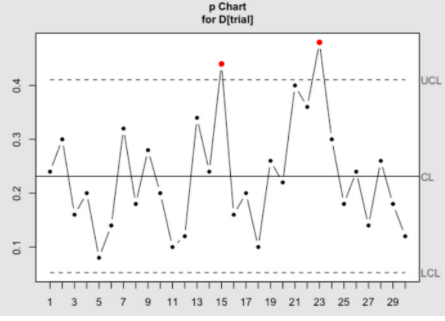
p Chart for D[trial] UCL 0.4 0.3 CL 0.2 0.1 LCL 1 3 5 7 9 11 13 15 17 19 21 23 25 27 29Step by Step Solution
There are 3 Steps involved in it
1 Expert Approved Answer
Step: 1 Unlock

Question Has Been Solved by an Expert!
Get step-by-step solutions from verified subject matter experts
Step: 2 Unlock
Step: 3 Unlock