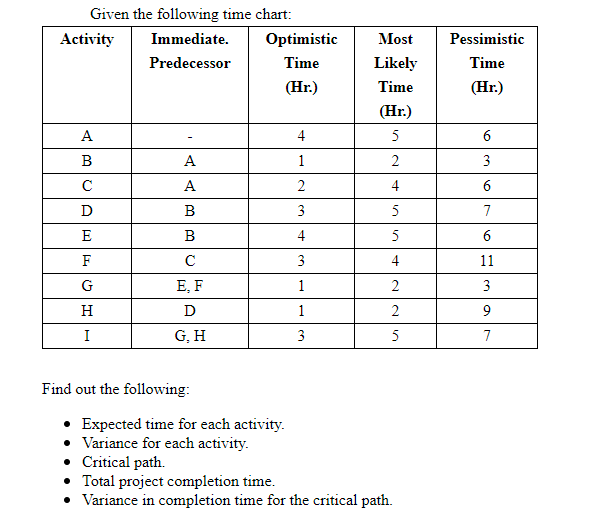
Question: Given the following time chart: Activity Immediate. Optimistic Predecessor Time (Hr.) Pessimistic Time (Hr.) Most Likely Time (Hr.) 5 2 4 6 A B A

Given the following time chart: Activity

Given the following time chart: Activity Immediate. Optimistic Predecessor Time (Hr.) Pessimistic Time (Hr.) Most Likely Time (Hr.) 5 2 4 6 A B A 1 A 2 4 3 6 7 D B 3 5 5 E B 4 6 F 3 4 11 2 3 G I EF D G H 1 1 9 2 5 3 7 Find out the following: Expected time for each activity. Variance for each activity. Critical path. Total project completion time. Variance in completion time for the critical path

Step by Step Solution

There are 3 Steps involved in it

1 Expert Approved Answer
Step: 1 Unlock blur-text-image
Question Has Been Solved by an Expert!

Get step-by-step solutions from verified subject matter experts

Step: 2 Unlock
Step: 3 Unlock

Students Have Also Explored These Related General Management Questions!