

Question: Given the following two functions shown below. The graph in green is y=f(x) and the graph in blue is y=g(x). Determine the intervals on x
Given the following two functions shown below. The graph in green is y=f(x) and the graph in blue is y=g(x). Determine the intervals on x where f(x) > g(x). Your solution must be entirely algebraic.

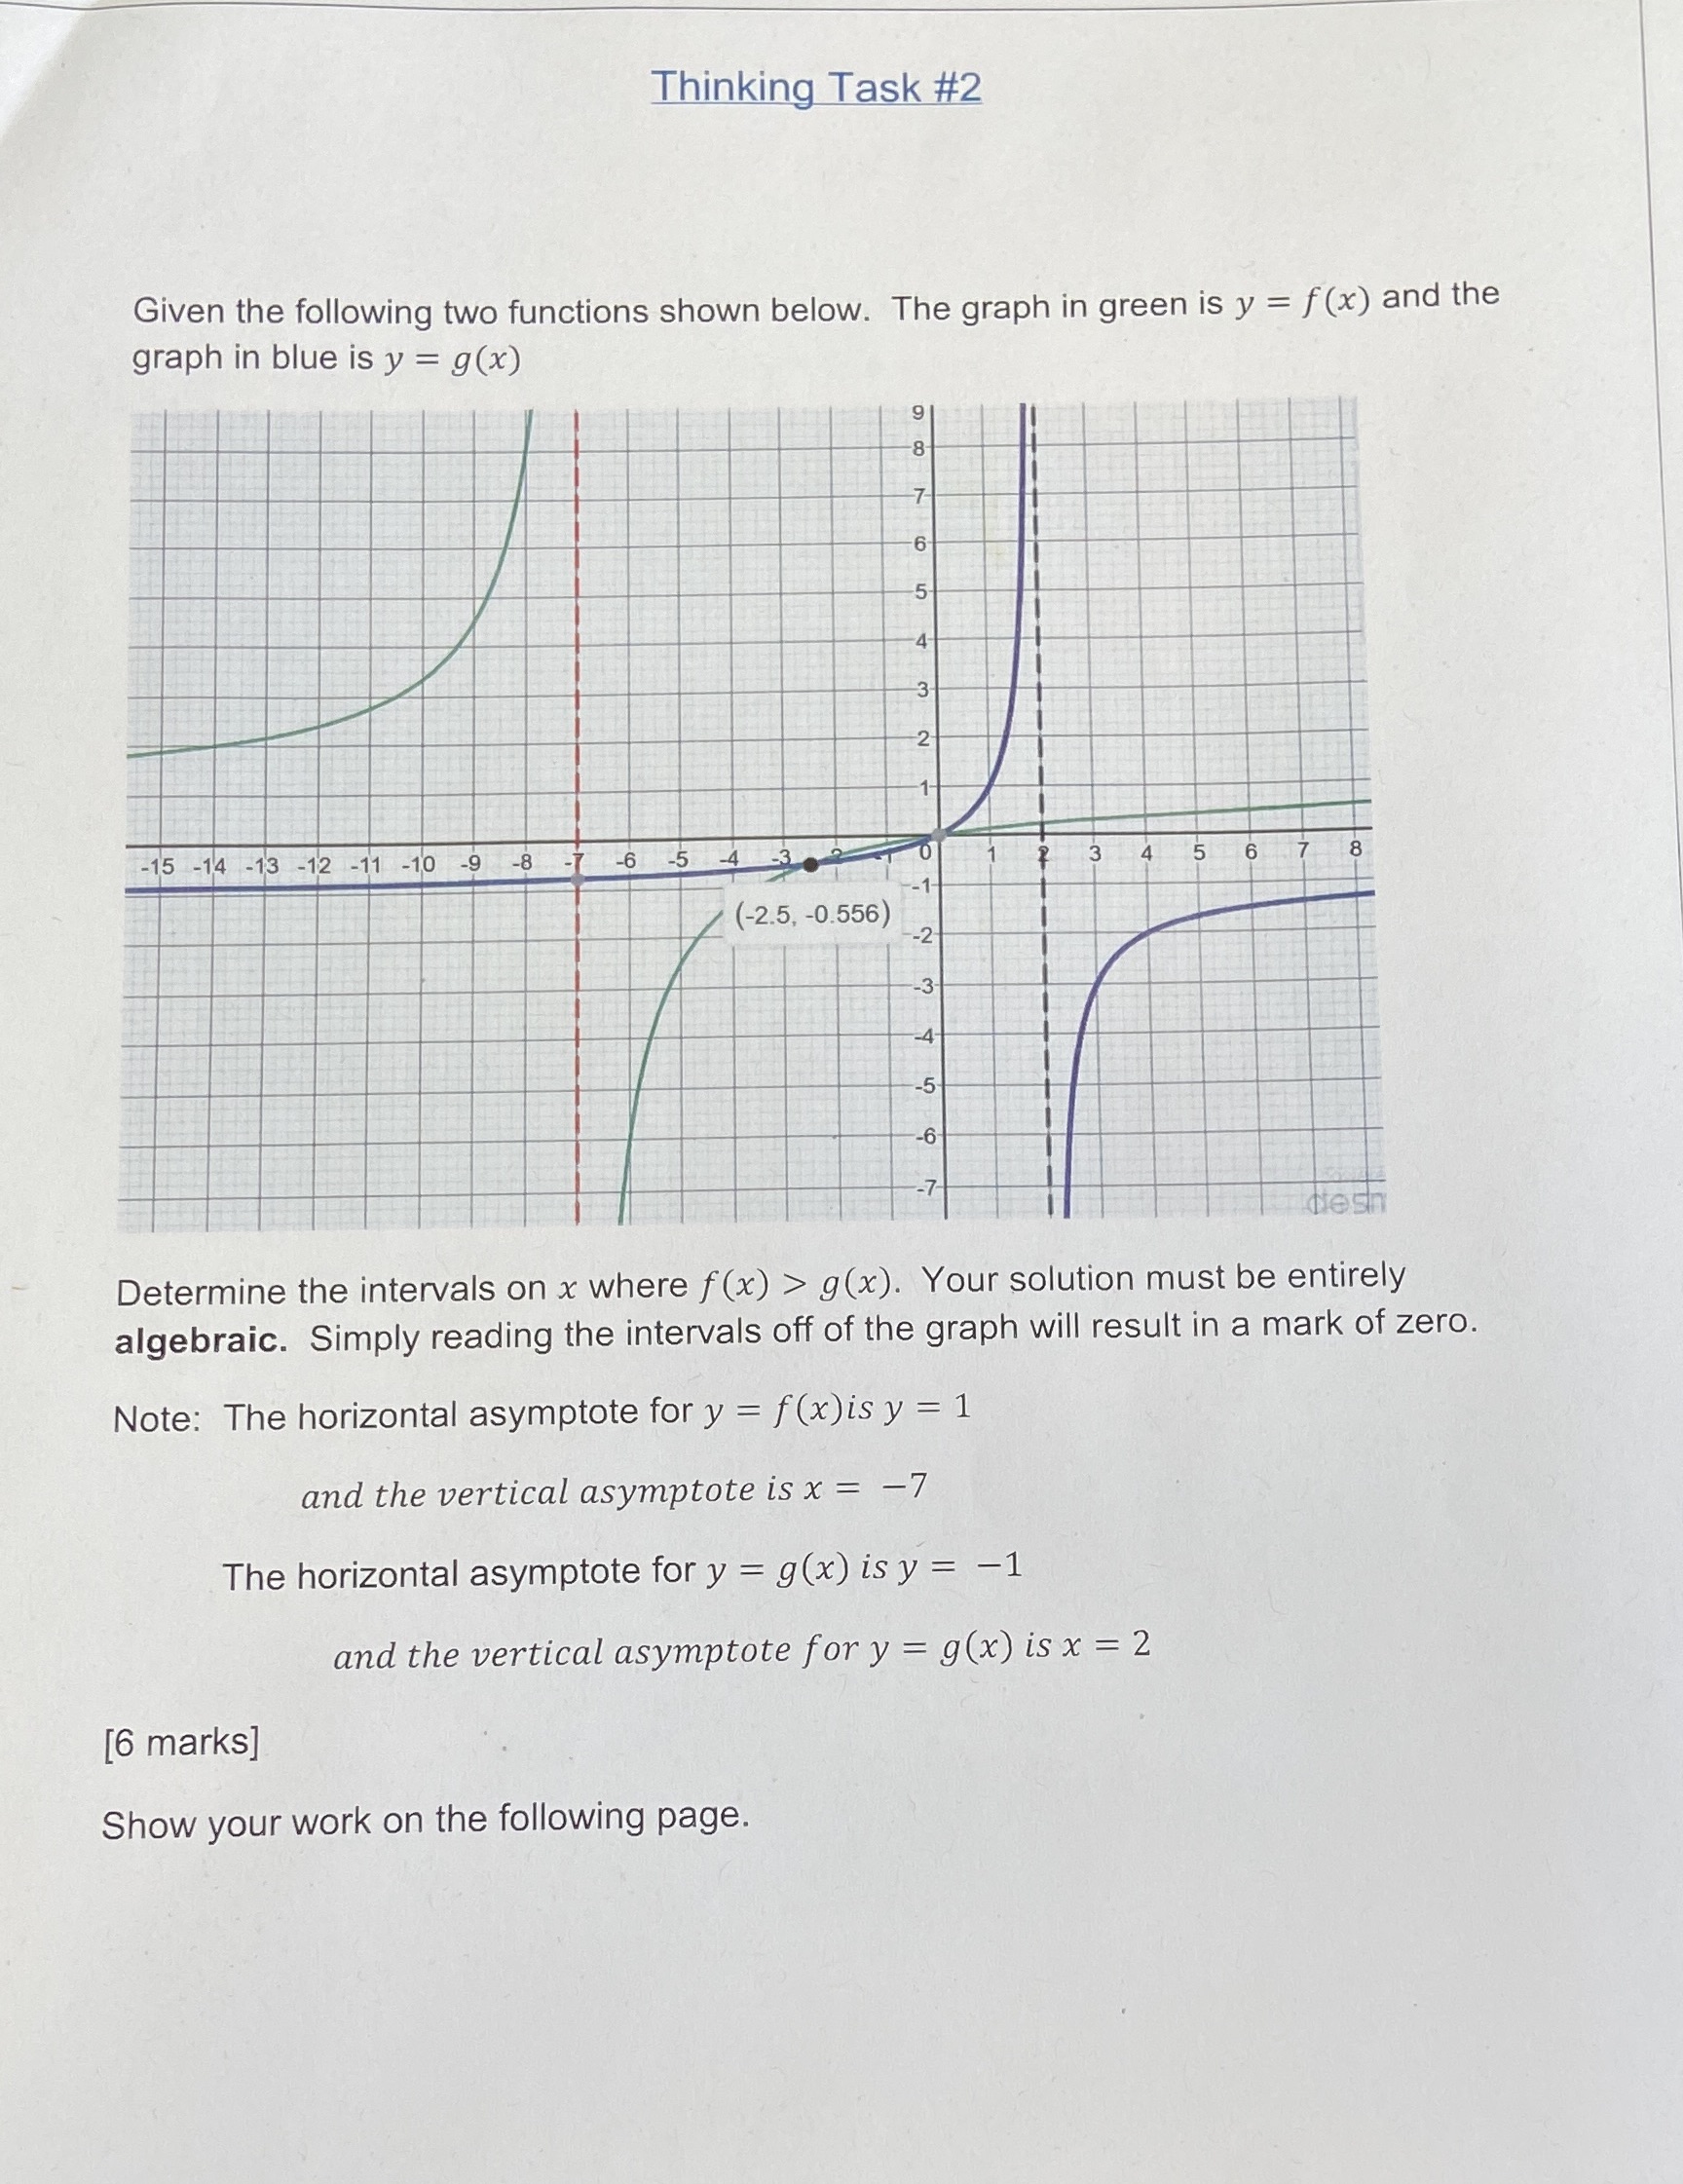
Thinking Task #2 Given the following two functions shown below. The graph in green is y = f(x) and the graph in blue is y = g(x) N -15 -14 -13 -12 -11 -10 -9 -8 -7 6 -5 4 -309 3 5 (-2.5, -0.556) --2 dlosh Determine the intervals on x where f (x) > g(x). Your solution must be entirely algebraic. Simply reading the intervals off of the graph will result in a mark of zero. Note: The horizontal asymptote for y = f(x)is y = 1 and the vertical asymptote is x = -7 The horizontal asymptote for y = g(x) is y = -1 and the vertical asymptote for y = g(x) is x = 2 [6 marks] Show your work on the following page
Step by Step Solution
There are 3 Steps involved in it

Get step-by-step solutions from verified subject matter experts