

Question: Given the graph below, what is the equilibrium quantity and price in the market? Price ($) $4.50 $4.25 $4.00 $3.75 $3.50 $3.25 $3.00 $2.75
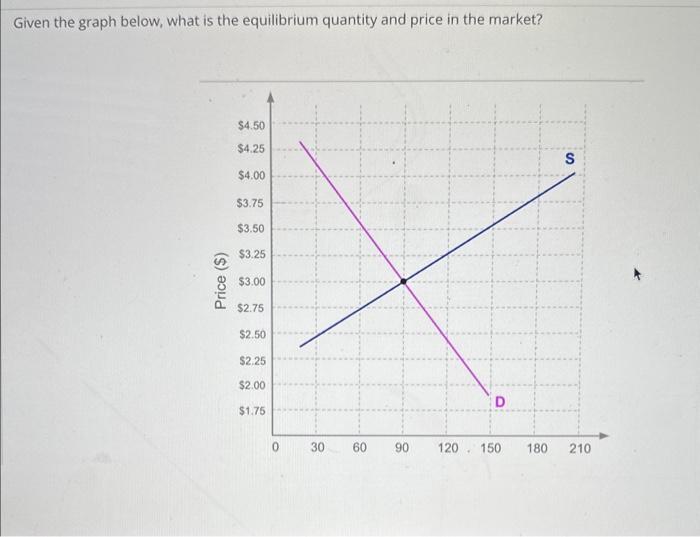
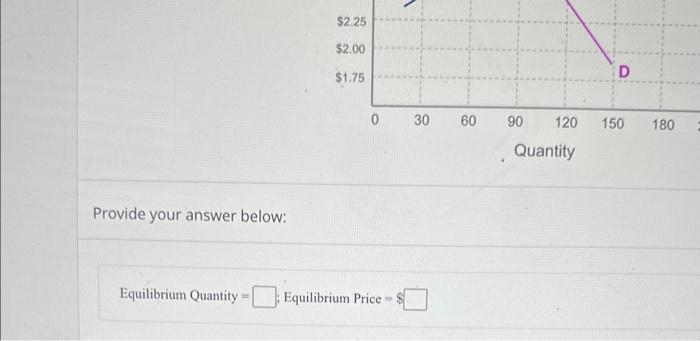
Given the graph below, what is the equilibrium quantity and price in the market? Price ($) $4.50 $4.25 $4.00 $3.75 $3.50 $3.25 $3.00 $2.75 $2.50 $2.25 $2.00 $1.75 0 30 60 90 120 150 180 S 210 Provide your answer below: Equilibrium Quantity: $2.25 $2.00 $1.75 0 Equilibrium Price W 30 60 90 120 Quantity D 150 180
Step by Step Solution
★★★★★
3.50 Rating (153 Votes )
There are 3 Steps involved in it
1 Expert Approved Answer
Step: 1 Unlock

Price S 450 425 400 325 350 S ... View full answer
Question Has Been Solved by an Expert!
Get step-by-step solutions from verified subject matter experts
Step: 2 Unlock
Step: 3 Unlock