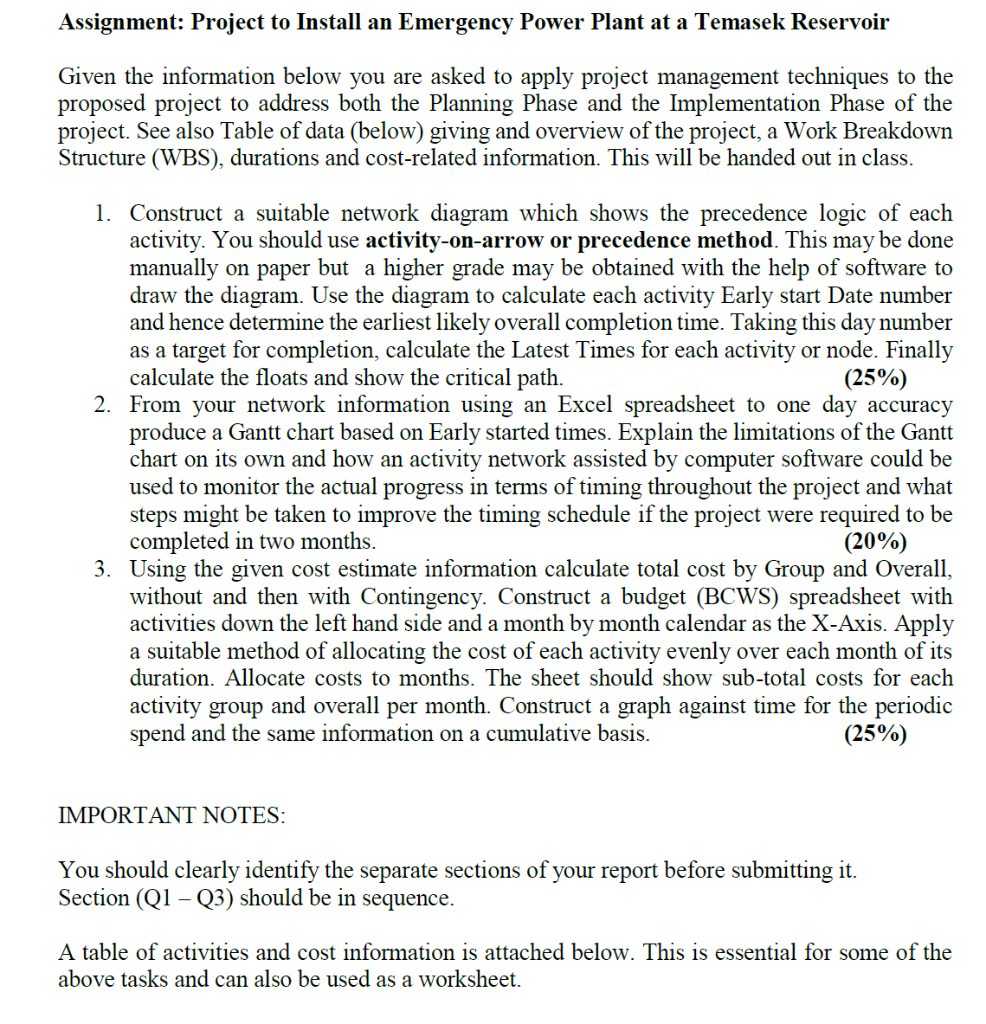
Question: Given the information below you are asked to apply project management techniques to the proposed project to address both the Planning Phase and the Implementation

Given the information below you are asked toGiven the information below you are asked toGiven the information below you are asked toGiven the information below you are asked to

Given the information below you are asked to apply project management techniques to the proposed project to address both the Planning Phase and the Implementation Phase of the project. See also Table of data (below) giving and overview of the project, a Work Breakdown Structure (WBS), durations and cost-related information. This will be handed out in class. 1. Construct a suitable network diagram which shows the precedence logic of each activity. You should use activity-on-arrow or precedence method. This may be done manually on paper but a higher grade may be obtained with the help of software to draw the diagram. Use the diagram to calculate each activity Early start Date number and hence determine the earliest likely overall completion time. Taking this day number as a target for completion, calculate the Latest Times for each activity or node. Finally calculate the floats and show the critical path. 2. From your network information using an Excel spreadsheet to one day accuracy produce a Gantt chart based on Early started times. Explain the limitations of the Gantt chart on its own and how an activity network assisted by computer software could be used to monitor the actual progress in terms of timing throughout the project and what steps might be taken to improve the timing schedule if the project were required to be completed in two months. (20%) 3. Using the given cost estimate information calculate total cost by Group and Overall, without and then with Contingency. Construct a budget (BCWS) spreadsheet with activities down the left hand side and a month by month calendar as the X-Axis. Apply a suitable method of allocating the cost of each activity evenly over each month of its duration. Allocate costs to months. The sheet should show sub-total costs for each activity group and overall per month. Construct a graph against time for the periodic spend and the same information on a cumulative basis. (25%) IMPORTANT NOTES: You should clearly identify the separate sections of your report before submitting it. Section (Q1-Q3) should be in sequence. A table of activities and cost information is attached below. This is essential for some of the above tasks and can also be used as a worksheet. \begin{tabular}{|c|l|l|l|} \hline Assessment Criteria & \multicolumn{1}{|c|}{Q1} & \multicolumn{1}{|c|}{ Q2 } & \multicolumn{1}{|c|}{Q3} \\ \hline W & \multicolumn{1}{|c|}{25%} & \multicolumn{10}{|c|}{20%} & \multicolumn{1}{|c|}{25%} \\ \hline Grading Criteria & Some attempt at logic & Poor but some attempt at chart & Poor attempt but some answers \\ \hline 3039% & Network but errors in logic \& calculations & Charts and explanations. Few errors & Method correct but some errors \\ \hline 4049% & Clearly logical diagram - few errors & Good chart and explanations & Accurate with only minor errors \\ \hline 5059% & Presentable and mostly correct & Very clear chart and explanations & Accurate with attached graphs \\ \hline 6069% & Good clear attempt using software & Accurate chart with useful practical explanations & Table and graphs are correct. \\ \hline 70+% & Excellent accurate network & Excellent chart and explanations & Very details presented. \\ \hline \end{tabular} Given the information below you are asked to apply project management techniques to the proposed project to address both the Planning Phase and the Implementation Phase of the project. See also Table of data (below) giving and overview of the project, a Work Breakdown Structure (WBS), durations and cost-related information. This will be handed out in class. 1. Construct a suitable network diagram which shows the precedence logic of each activity. You should use activity-on-arrow or precedence method. This may be done manually on paper but a higher grade may be obtained with the help of software to draw the diagram. Use the diagram to calculate each activity Early start Date number and hence determine the earliest likely overall completion time. Taking this day number as a target for completion, calculate the Latest Times for each activity or node. Finally calculate the floats and show the critical path. 2. From your network information using an Excel spreadsheet to one day accuracy produce a Gantt chart based on Early started times. Explain the limitations of the Gantt chart on its own and how an activity network assisted by computer software could be used to monitor the actual progress in terms of timing throughout the project and what steps might be taken to improve the timing schedule if the project were required to be completed in two months. (20%) 3. Using the given cost estimate information calculate total cost by Group and Overall, without and then with Contingency. Construct a budget (BCWS) spreadsheet with activities down the left hand side and a month by month calendar as the X-Axis. Apply a suitable method of allocating the cost of each activity evenly over each month of its duration. Allocate costs to months. The sheet should show sub-total costs for each activity group and overall per month. Construct a graph against time for the periodic spend and the same information on a cumulative basis. (25%) IMPORTANT NOTES: You should clearly identify the separate sections of your report before submitting it. Section (Q1-Q3) should be in sequence. A table of activities and cost information is attached below. This is essential for some of the above tasks and can also be used as a worksheet. \begin{tabular}{|c|l|l|l|} \hline Assessment Criteria & \multicolumn{1}{|c|}{Q1} & \multicolumn{1}{|c|}{ Q2 } & \multicolumn{1}{|c|}{Q3} \\ \hline W & \multicolumn{1}{|c|}{25%} & \multicolumn{10}{|c|}{20%} & \multicolumn{1}{|c|}{25%} \\ \hline Grading Criteria & Some attempt at logic & Poor but some attempt at chart & Poor attempt but some answers \\ \hline 3039% & Network but errors in logic \& calculations & Charts and explanations. Few errors & Method correct but some errors \\ \hline 4049% & Clearly logical diagram - few errors & Good chart and explanations & Accurate with only minor errors \\ \hline 5059% & Presentable and mostly correct & Very clear chart and explanations & Accurate with attached graphs \\ \hline 6069% & Good clear attempt using software & Accurate chart with useful practical explanations & Table and graphs are correct. \\ \hline 70+% & Excellent accurate network & Excellent chart and explanations & Very details presented. \\ \hline \end{tabular}

Step by Step Solution

There are 3 Steps involved in it

1 Expert Approved Answer
Step: 1 Unlock blur-text-image
Question Has Been Solved by an Expert!

Get step-by-step solutions from verified subject matter experts

Step: 2 Unlock
Step: 3 Unlock

Students Have Also Explored These Related General Management Questions!