

Given the information in the projected income statements, and assuming the projected improvements in working capital (that
Question:
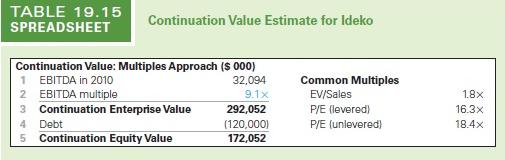
Given the information in the projected income statements, and assuming the projected improvements in working capital (that is, Ideko's working capital requirements though 2010 will be as shown here), use EBITDA as a multiple to estimate the continuation value in 2010 (reproduce Table 19.15), assuming the EBITDA multiple for Ideko remains at 9.1× Infer the EV/sales and the unlevered and levered P/E ratios implied by the continuation value you calculated. Also assume that Ideko's production plant will require an expansion in 2010, and that the cost of this expansion, $15.3 million, will be added to Ideko's debt in 2010. Ideko's balance sheet for 2005 is shown here. Ideko's free cash flows through 2010 are shown here
Income Statement ($ 000) | 2005 | 2006 | 2007 | 2008 | 2009 | 2010 |
Sales | 74,600 | 85,148 | 96,453 | 108,901 | 122,594 | 137,644 |
Cost of Goods Sold | ||||||
Raw Materials | -16,000 | -17,667 | -19,815 | -22,153 | -24,694 | -27,454 |
Direct Labor Costs | -18,000 | -21,092 | -24,408 | -28,154 | -32,378 | -37,139 |
Gross Profit | 40,600 | 46,389 | 52,230 | 58,594 | 65,522 | 73,051 |
Sales and Marketing | -11,250 | -14,024 | -17,284 | -21,094 | -24,298 | -27,281 |
Administrative | -13,500 | -12,925 | -14,642 | -15,442 | -16,158 | -18,141 |
EBITDA | 15,850 | 19,440 | 20,304 | 22,058 | 25,066 | 27,629 |
Depreciation | -5,500 | -5,950 | -5,850 | -5,760 | -5,679 | -7,136 |
EBIT | 10,350 | 13,490 | 14,454 | 16,298 | 19,387 | 20,493 |
Interest Expense (net) | -75 | -6,680 | -6,680 | -6,680 | -6,680 | -6,680 |
Pretax Income | 10,275 | 6,810 | 7,774 | 9,618 | 12,707 | 13,813 |
Income Tax | -3,596 | -2,384 | -2,721 | -3,366 | -4,447 | -4,835 |
Net Income | 6,679 | 4,426 | 5,053 | 6,252 | 8,260 | 8,978 |
Working Capital Days | 2005 | > 2005 | |
Assets | Based on: | Days | Days |
Accounts Receivable | Sales Revenue | 90 | 90 |
Raw Materials | Raw Materials Costs | 45 | 45 |
Finished Goods | Raw Materials+Labor Costs | 45 | 45 |
Minimum Cash Balance | Sales Revenue | 30 | 30 |
Liabilities | |||
Wages Payable | Direct Labor+Admin Costs | 15 | 15 |
Other Accounts Payable | Raw Materials+Sales and Marketing | 45 | 45 |
Working Capital ($ 000) | 2005 | 2006 | 2007 | 2008 | 2009 | 2010 |
Assets | ||||||
Accounts Receivable | 54,550 | 20,995 | 23,783 | 26,852 | 30,229 | 33,940 |
Raw Materials | 1,973 | 2,178 | 2,443 | 2,731 | 3,044 | 3,385 |
Finished Goods | 4,192 | 4,779 | 5,452 | 6,202 | 7,036 | 7,964 |
Minimum Cash Balance | 6,132 | 6,998 | 7,928 | 8,951 | 10,076 | 11,313 |
Total Current Assets | 66,847 | 34,950 | 39,606 | 44,736 | 50,385 | 56,602 |
Labilities | ||||||
Wages Payable | 1,295 | 1,398 | 1,605 | 1,792 | 1,995 | 2,272 |
Other Accounts Payable | 3,360 | 3,907 | 4,574 | 5,332 | 6,040 | 6,748 |
Total Current Liabilities | 4,655 | 5,305 | 6,179 | 7,124 | 8,035 | 9,020 |
Net Working Capital | 62,192 | 29,645 | 33,427 | 37,612 | 42,350 | 47,582 |
Increase in Net Working Capital | -32,547 | 3,782 | 4,185 | 4,738 | 5,232 |
Estimated 2005 Balance Sheet Data for | ||
Balance Sheet ($ 000) | ||
Assets | ||
Cash and Equivalents | 6164 | |
Accounts Receivable | 54550 | |
Inventories | 6165 | |
Total Current Assets | 66879 | |
Property, Plant, and Equipment | 54550 | |
Goodwill | 72332 | |
Total Assets | 193761 | |
Liabilities and Stockholders' Equity | ||
Accounts Payable | 4654 | |
Debt | 100000 | |
Total Liabilities | 104654 | |
Stockholders' Equity | 89107 | |
Total Liabilities and Equity | 193761 |
Free Cash Flow ($ 000) | 2005 | 2006 | 2007 | 2008 | 2009 | 2010 |
Net Income | 4,426 | 5,053 | 6,252 | 8,260 | 8,978 | |
Plus: After-tax Interest Expense | 4,342 | 4,342 | 4,342 | 4,342 | 4,342 | |
Unlevered Net Income | 8,768 | 9,395 | 10,594 | 12,602 | 13,320 | |
Plus: Depreciation | 5,950 | 5,850 | 5,760 | 5,679 | 7,136 | |
Less: Increase in NWC | 32,547 | -3,782 | -4,185 | -4,738 | -5,232 | |
Less: Capital Expenditures | -4,950 | -4,950 | -4,950 | -4,950 | -20,250 | |
Free Cash Flow of Firm | 42,315 | 6,513 | 7,219 | 8,593 | -5,026 | |
Plus: Net Borrowing | 15,300 | |||||
Less: After-tax Interest Expense | -4,342 | -4,342 |
Expert Answer:
To estimate the continuation value in 2010 using the EBITDA multiple we need the EBITDA for 2010 and ... View the full answer


Foundations of Financial Management
ISBN: 978-1259024979
10th Canadian edition
Authors: Stanley Block, Geoffrey Hirt, Bartley Danielsen, Doug Short, Michael Perretta
