

Question: Given the information in the table on KMS : . did KMS's expansion plan call for it to grow slower or faster than its sustainable
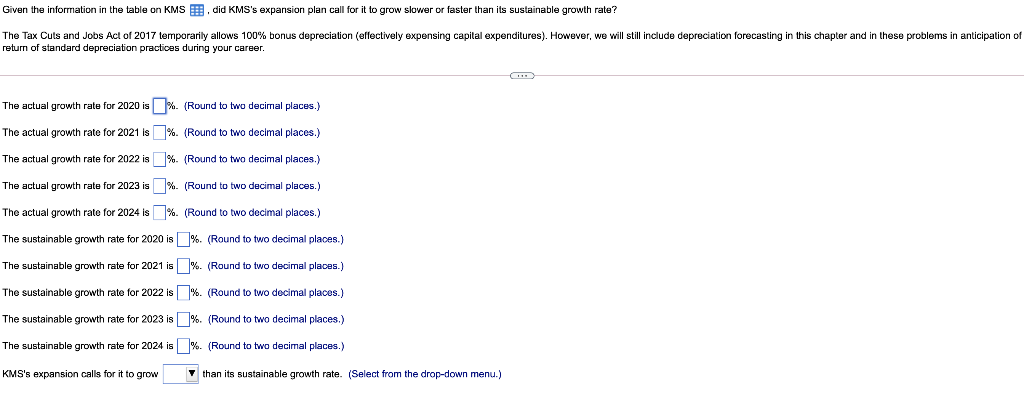
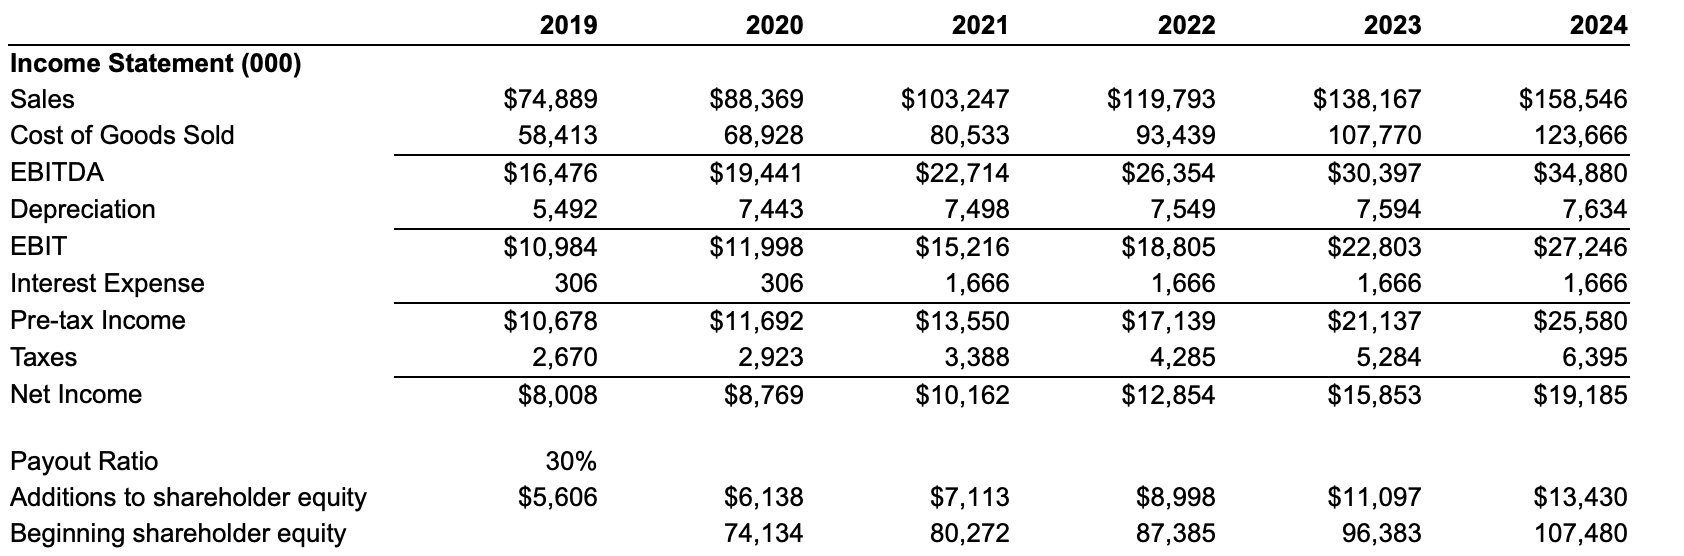
Given the information in the table on KMS : . did KMS's expansion plan call for it to grow slower or faster than its sustainable growth rate? The Tax Cuts and Jobs Act of 2017 temporarily allows 100% bonus depreciation (effectively expensing capital expenditures). However, we will still include depreciation forecasting in this chapter and in these problems in anticipation of return of standard depreciation practices during your career. The actual growth rate for 2020 is_%. (Round to two decimal places.) The actual growth rate for 2021 is %. (Round to two decimal places.) The actual growth rate for 2022 is % (Round to two decimal places.) The actual growth rate for 2023 is %. (Round to two decimal places.) The actual growth rate for 2024 is %. (Round to two decimal places.) The sustainable growth rate for 2020 is %. (Round to two decimal places.) The sustainable growth rate for 2021 is%. (Round to two decimal places.) The sustainable growth rate for 2022 is%. (Round to two decimal places.) The sustainable growth rate for 2023 is%. (Round to two decimal places.) The sustainable growth rate for 2024 is %. (Round to two decimal places.) KMS's expansion calls for it to grow V than its sustainable growth rate. (Select from the drop-down menu.) 2019 2020 2021 2022 2023 2024 Income Statement (000) Sales Cost of Goods Sold EBITDA Depreciation EBIT Interest Expense Pre-tax Income Taxes Net Income $74,889 58,413 $16,476 5,492 $10,984 306 $10,678 2,670 $8,008 $88,369 68,928 $19,441 7,443 $11,998 306 $11,692 2,923 $8,769 $103,247 80,533 $22,714 7,498 $15,216 1,666 $13,550 3,388 $10,162 $119,793 93,439 $26,354 7,549 $18,805 1,666 $17,139 4,285 $12,854 $138,167 107,770 $30,397 7,594 $22,803 1,666 $21,137 5,284 $15,853 $158,546 123,666 $34,880 7,634 $27,246 1,666 $25,580 6,395 $19,185 Payout Ratio Additions to shareholder equity Beginning shareholder equity 30% $5,606 $6,138 74,134 $7,113 80,272 $8,998 87,385 $11,097 96,383 $13,430 107,480
Step by Step Solution
There are 3 Steps involved in it

Get step-by-step solutions from verified subject matter experts