

Question: Given the information in the table on KMS Edid KMS's expansion plan call for it to grow slower or faster than its sustainable growth rate?
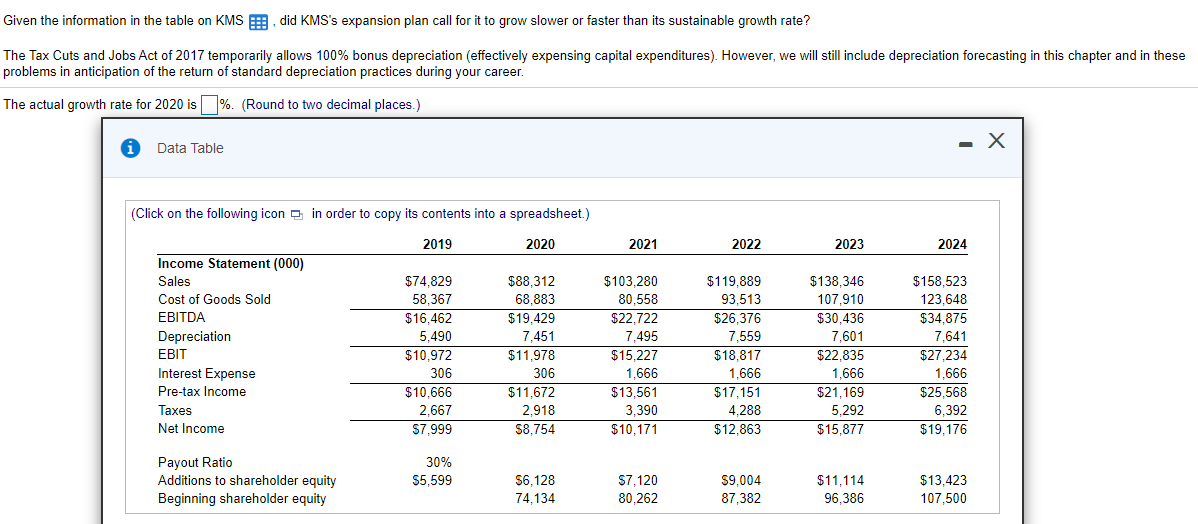
Given the information in the table on KMS Edid KMS's expansion plan call for it to grow slower or faster than its sustainable growth rate? The Tax Cuts and Jobs Act of 2017 temporarily allows 100% bonus depreciation (effectively expensing capital expenditures). However, we will still include depreciation forecasting in this chapter and in these problems in anticipation of the return of standard depreciation practices during your career. The actual growth rate for 2020 is %. (Round to two decimal places.) Data Table (Click on the following icon in order to copy its contents into a spreadsheet.) 2019 2020 2021 2022 2023 2024 Income Statement (000) Sales Cost of Goods Sold EBITDA Depreciation $138,346 107.910 $30,436 7,601 EBIT $74.829 58,367 $16,462 5,490 $10,972 306 $10,666 2,667 $7,999 $88,312 68,883 $19,429 7,451 $11,978 306 $11,672 2,918 $8.754 $103,280 80,558 $22,722 7,495 $15.227 1,666 $13,561 3,390 $10,171 $119,889 93,513 $26,376 7,559 $18.817 1,666 $17,151 4,288 $12.863 $158,523 123,648 $34,875 7,641 $27,234 1,666 $25,568 6,392 $19,176 $22,835 1,666 $21,169 5,292 $15,877 Interest Expense Pre-tax Income Taxes Net Income Payout Ratio Additions to shareholder equity Beginning shareholder equity 30% $5,599 $6,128 74,134 $7,120 80,262 $9,004 87,382 $11,114 96,386 $13,423 107,500 Given the information in the table on KMS Edid KMS's expansion plan call for it to grow slower or faster than its sustainable growth rate? The Tax Cuts and Jobs Act of 2017 temporarily allows 100% bonus depreciation (effectively expensing capital expenditures). However, we will still include depreciation forecasting in this chapter and in these problems in anticipation of the return of standard depreciation practices during your career. The actual growth rate for 2020 is %. (Round to two decimal places.) Data Table (Click on the following icon in order to copy its contents into a spreadsheet.) 2019 2020 2021 2022 2023 2024 Income Statement (000) Sales Cost of Goods Sold EBITDA Depreciation $138,346 107.910 $30,436 7,601 EBIT $74.829 58,367 $16,462 5,490 $10,972 306 $10,666 2,667 $7,999 $88,312 68,883 $19,429 7,451 $11,978 306 $11,672 2,918 $8.754 $103,280 80,558 $22,722 7,495 $15.227 1,666 $13,561 3,390 $10,171 $119,889 93,513 $26,376 7,559 $18.817 1,666 $17,151 4,288 $12.863 $158,523 123,648 $34,875 7,641 $27,234 1,666 $25,568 6,392 $19,176 $22,835 1,666 $21,169 5,292 $15,877 Interest Expense Pre-tax Income Taxes Net Income Payout Ratio Additions to shareholder equity Beginning shareholder equity 30% $5,599 $6,128 74,134 $7,120 80,262 $9,004 87,382 $11,114 96,386 $13,423 107,500
Step by Step Solution
There are 3 Steps involved in it

Get step-by-step solutions from verified subject matter experts