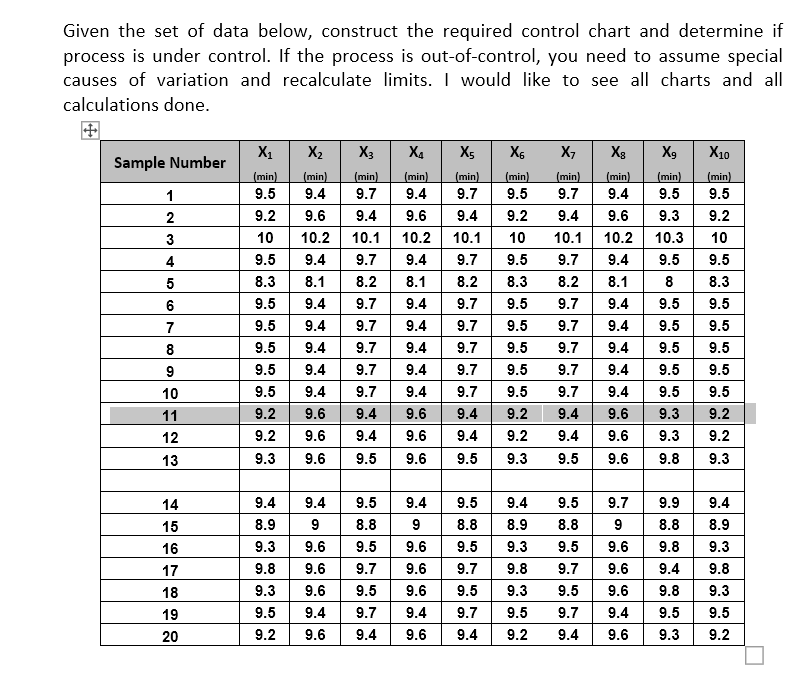
Question: Given the set of data below, construct the required control chart and determine if process is under control. If the process is out-of-control, you need

Given the set of data below, construct the

Given the set of data below, construct the required control chart and determine if process is under control. If the process is out-of-control, you need to assume special causes of variation and recalculate limits. I would like to see all charts and all calculations done. . Xa X6 Sample Number (min) 9.5 X10 (min) 9.5 9.2 1 2 3 4 X2 (min) 9.4 9.6 10.2 9.4 8.1 9.4 | 5 X1 (min) 9.5 9.2 10 9.5 8.3 9.5 9.5 9.5 9.5 9.5 9.2 9.2 9.3 6 7 X3 (min) 9.7 9.4 10.1 9.7 8.2 9.7 9.7 9.7 9.7 9.7 9.4 9.4 9.5 | | X; (min) 9.7 9.4 10.1 9.7 8.2 9.7 9.7 9.7 9.7 9.7 9.4 9.4 9.5 (min) 9.4 9.6 10.2 9.4 8.1 9.4 9.4 9.4 9.4 9.4 9.6 9.6 9.6 X7 (min) 9.7 9.4 10.1 9.7 8.2 9.7 9.7 9.7 9.7 9.7 9.4 9.4 9.5 9.2 10 9.5 8.3 9.5 9.5 9.5 9.5 9.5 9.2 9.2 9.3 | X8 (min) 9.4 9.6 10.2 9.4 8.1 9.4 9.4 9.4 9.4 9.4 9.6 9.6 9.6 Xg (min) 9.5 9.3 10.3 9.5 8 9.5 9.5 9.5 9.5 9.5 9.3 9.3 9.8 9 10 11 12 13 9.4 9.6 9.6 9.6 9.5 9.5 9.5 9.2 9.2 9.3 | 9.4 8.9 14 15 16 17 18 19 20 9.4 8.9 9.3 9.8 9.3 9.5 9.2 9.4 9 9.6 9.6 9.6 | | | | | | | 9.5 8.8 9.5 9.7 9.5 9.4 9 9.6 9.6 9.6 9.4 9.6 9.5 8.8 9.5 9.7 9.5 9.7 9.4 9.4 8.9 9.3 9.8 9.3 9.5 9.2 9.5 8.8 9.5 9.7 9.5 9.7 9.4 9.7 9 9.6 9.6 9.6 9.4 9.6 9.9 8.8 9.8 9.4 9.8 9.3 9.8 9.3 9.5 9.2 9.4 9.7 9.5 9.6 9.3

Step by Step Solution

There are 3 Steps involved in it

1 Expert Approved Answer
Step: 1 Unlock blur-text-image
Question Has Been Solved by an Expert!

Get step-by-step solutions from verified subject matter experts

Step: 2 Unlock
Step: 3 Unlock

Students Have Also Explored These Related General Management Questions!