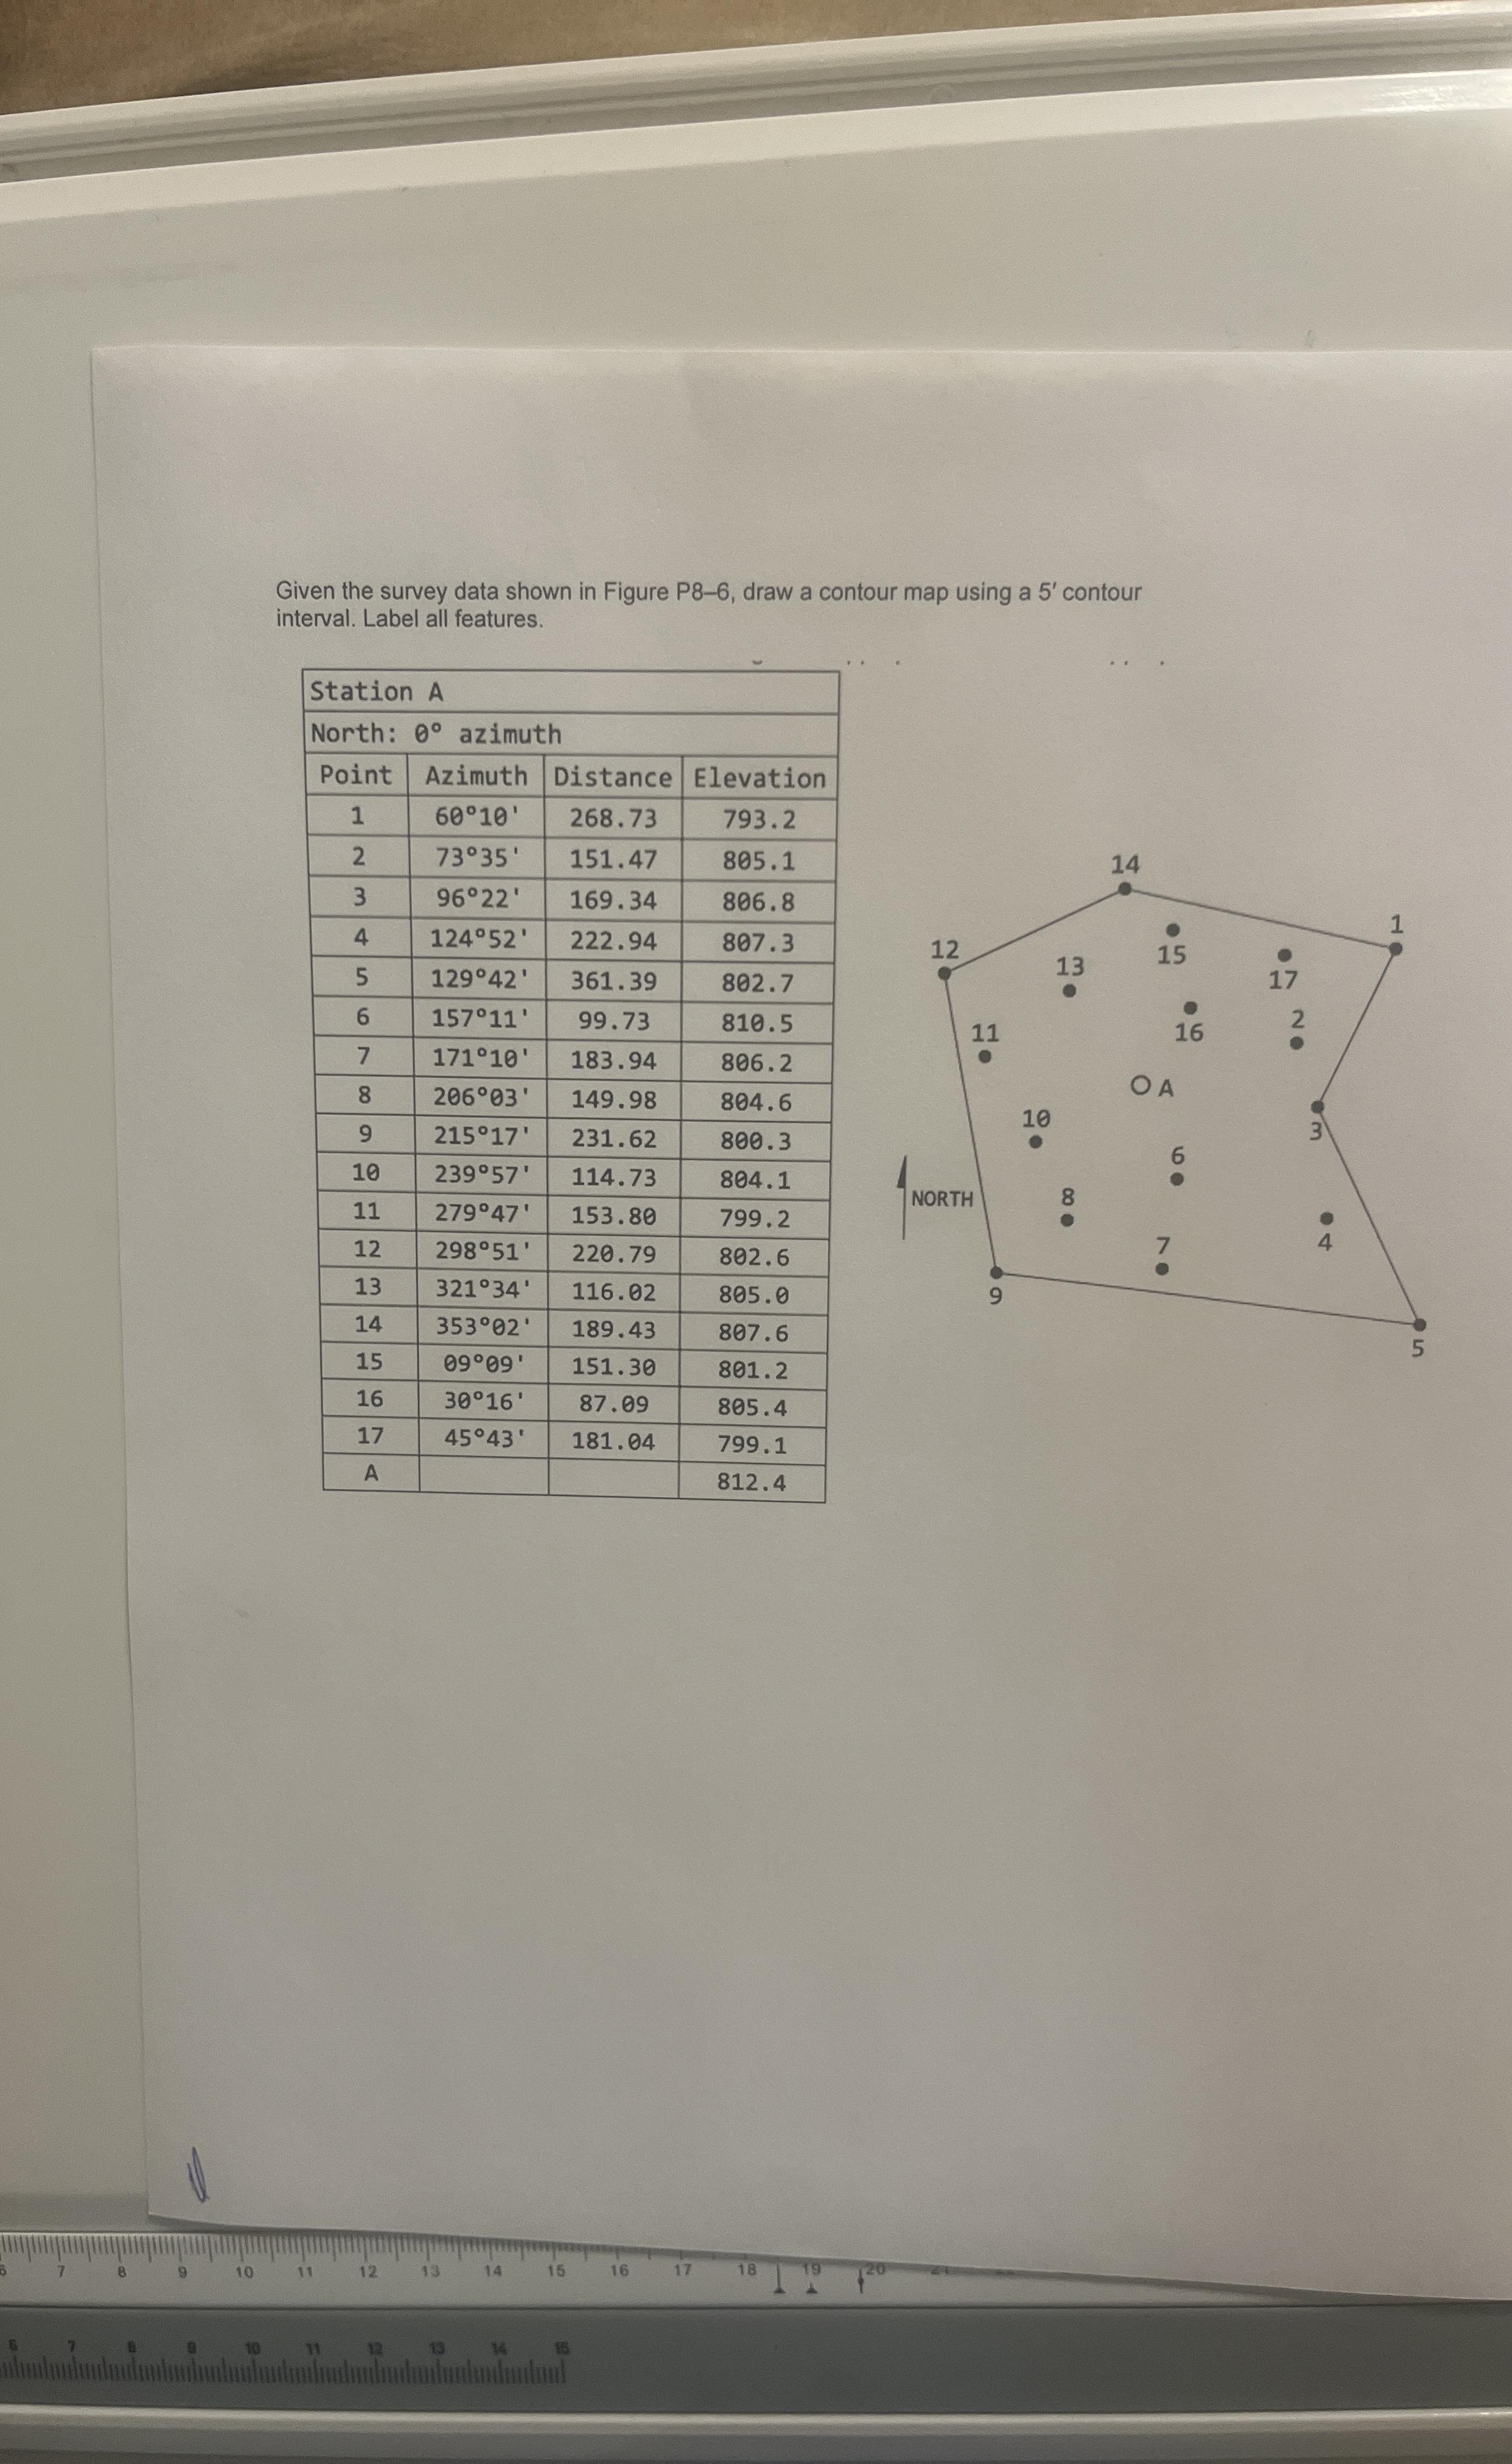
Question: Given the survey data shown in Figure P 8 - 6 , draw a contour map using a 5 ' contour interval. Label all features.

Given the survey data shown in Figure P8-6, draw a contour map using a 5' contour interval. Label all features.
\table[[Station A],[North: 0 azimuth],[Point,Azimuth,Distance,Elevation],[1,6010',268.73,793.2],[2,7335',151.47,805.1],[3,9622',169.34,806.8],[4,12452',222.94,807.3],[5,12942',361.39,802.7],[6,15711',99.73,810.5],[7,17110',183.94,806.2],[8,20603',149.98,804.6],[9,21517',231.62,800.3],[10,23957',114.73,804.1],[11,27947',153.80,799.2],[12,29851',220.79,802.6],[13,32134',116.02,805.0],[14,35302',189.43,807.6],[15,0909',151.30,801.2],[16,3016',87.09,805.4],[17,4543',181.04,799.1],[A,,,812.4]]
Given the survey data shown in Figure P 8 - 6 ,

Step by Step Solution

There are 3 Steps involved in it

1 Expert Approved Answer
Step: 1 Unlock blur-text-image
Question Has Been Solved by an Expert!

Get step-by-step solutions from verified subject matter experts

Step: 2 Unlock
Step: 3 Unlock

Students Have Also Explored These Related Civil Engineering Questions!