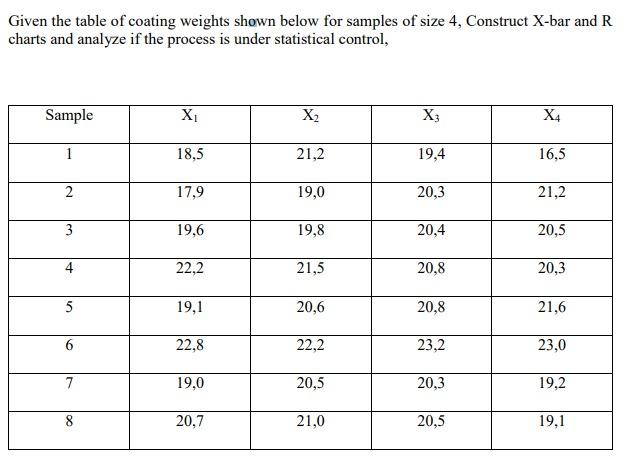
Question: Given the table of coating weights shown below for samples of size 4, Construct X-bar and R charts and analyze if the process is under

Given the table of coating weights shown below

Given the table of coating weights shown below for samples of size 4, Construct X-bar and R charts and analyze if the process is under statistical control, Sample X X2 X: X4 1 18,5 21,2 19,4 16,5 2 17,9 19,0 20,3 21,2 3 19,6 19,8 20,4 20,5 4 22,2 21,5 20,8 20,3 5 19,1 20,6 20,8 21,6 6 22,8 22,2 23,2 23,0 7 19,0 20,5 20,3 19,2 8 8 20,7 21,0 20,5 19,1

Step by Step Solution

There are 3 Steps involved in it

1 Expert Approved Answer
Step: 1 Unlock blur-text-image
Question Has Been Solved by an Expert!

Get step-by-step solutions from verified subject matter experts

Step: 2 Unlock
Step: 3 Unlock

Students Have Also Explored These Related General Management Questions!