

Question: Giving the following table and using excel Date A B C D index 3-Jan-16 84.87 14.05 67.55 41.7 6,517.71 10-Jan-16 67.02 12.25 57.84 37.4 6,038.03
Giving the following table and using excel
| Date | A | B | C | D | index |
| 3-Jan-16 | 84.87 | 14.05 | 67.55 | 41.7 | 6,517.71 |
| 10-Jan-16 | 67.02 | 12.25 | 57.84 | 37.4 | 6,038.03 |
| 17-Jan-16 | 54.05 | 9.7 | 45.8 | 34 | 5,459.84 |
| 24-Jan-16 | 59.93 | 10.35 | 47.07 | 38.6 | 5,698.56 |
| 31-Jan-16 | 66.53 | 11.4 | 55.09 | 41.1 | 5,927.36 |
| 7-Feb-16 | 64.82 | 11.65 | 52.35 | 42.5 | 5,832.92 |
| 14-Feb-16 | 62.13 | 11.2 | 39.89 | 41 | 5,801.65 |
| 21-Feb-16 | 66.28 | 11.3 | 40.74 | 41.8 | 5,942.28 |
| 28-Feb-16 | 68.24 | 11.95 | 42 | 42.8 | 6,170.16 |
| 6-Mar-16 | 67.51 | 12.35 | 47.07 | 44.5 | 6,370.37 |
| 13-Mar-16 | 76.07 | 12.8 | 49.39 | 44 | 6,305.78 |
| 20-Mar-16 | 72.15 | 13.35 | 49.18 | 43 | 6,460.98 |
| 27-Mar-16 | 68 | 13.25 | 50.66 | 41 | 6,215.65 |
| 3-Apr-16 | 64.33 | 13.9 | 43.27 | 41.8 | 6,213.58 |
| 10-Apr-16 | 66.04 | 14.5 | 47.7 | 44.5 | 6,442.04 |
| 17-Apr-16 | 66.77 | 14.95 | 47.07 | 47.5 | 6,512.43 |
| 24-Apr-16 | 69.95 | 15.05 | 53.61 | 49.1 | 6,820.30 |
| 1-May-16 | 67.26 | 14 | 57.84 | 48 | 6,586.50 |
| 8-May-16 | 71.18 | 13.55 | 61.64 | 50.5 | 6,654.20 |
| 15-May-16 | 68.97 | 14.2 | 58.68 | 51 | 6,737.40 |
QUESTIONS
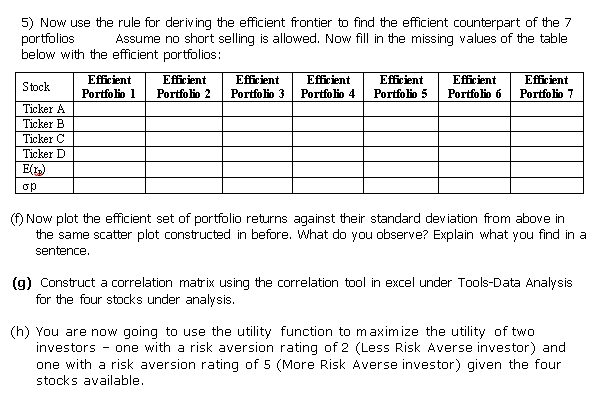
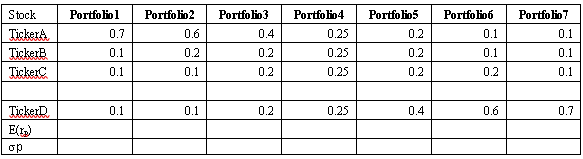
Portfoliol 0.7 Portfolio 0.6 0.2 Portfolio 0.1 Stock Tickers Ticker Ticker Portfolio 0.1 Portfolio 3 0.4 0.2 0.2 Portfolio 4 0.25 0.25 0.25 Portfolio 5 0.2 0.2 0.2 0.1 0.1 0.1 0.1 0.1 0.2 0.1 0.1 0.1 0.2 0.25 0.4 0.6 0.7 TickerD E{ID) op 5) Now use the rule for deriving the efficient frontier to find the efficient counterpart of the 7 portfolios Assume no short selling is allowed. Now fill in the missing values of the table below with the efficient portfolios: Stock Efficient Portfolio 1 Efficient Portfolio 2 Efficient Portfolio 3 Efficient Portfolio 4 Efficient Portfolio 5 Efficient Portfolio 6 Efficient Portfolio 7 Ticker A Ticker B Ticker C Ticker D Elr) op (1) Now plot the efficient set of portfolio returns against their standard deviation from above in the same scatter plot constructed in before. What do you observe? Explain what you find in a sentence. (9) Construct a correlation matrix using the correlation tool in excel under Tools-Data Analysis for the four stocks under analysis. (h) You are now going to use the utility function to maximize the utility of two investors - one with a risk aversion rating of 2 (Less Risk Averse investor) and one with a risk aversion rating of 5 (More Risk Averse investor) given the four stocks available. Portfoliol 0.7 Portfolio 0.6 0.2 Portfolio 0.1 Stock Tickers Ticker Ticker Portfolio 0.1 Portfolio 3 0.4 0.2 0.2 Portfolio 4 0.25 0.25 0.25 Portfolio 5 0.2 0.2 0.2 0.1 0.1 0.1 0.1 0.1 0.2 0.1 0.1 0.1 0.2 0.25 0.4 0.6 0.7 TickerD E{ID) op 5) Now use the rule for deriving the efficient frontier to find the efficient counterpart of the 7 portfolios Assume no short selling is allowed. Now fill in the missing values of the table below with the efficient portfolios: Stock Efficient Portfolio 1 Efficient Portfolio 2 Efficient Portfolio 3 Efficient Portfolio 4 Efficient Portfolio 5 Efficient Portfolio 6 Efficient Portfolio 7 Ticker A Ticker B Ticker C Ticker D Elr) op (1) Now plot the efficient set of portfolio returns against their standard deviation from above in the same scatter plot constructed in before. What do you observe? Explain what you find in a sentence. (9) Construct a correlation matrix using the correlation tool in excel under Tools-Data Analysis for the four stocks under analysis. (h) You are now going to use the utility function to maximize the utility of two investors - one with a risk aversion rating of 2 (Less Risk Averse investor) and one with a risk aversion rating of 5 (More Risk Averse investor) given the four stocks available
Step by Step Solution
There are 3 Steps involved in it

Get step-by-step solutions from verified subject matter experts