

Question: Giving the following table and using excel Date A B C D index 3-Jan-16 84.87 14.05 67.55 41.7 6,517.71 10-Jan-16 67.02 12.25 57.84 37.4 6,038.03
Giving the following table and using excel
| Date | A | B | C | D | index |
| 3-Jan-16 | 84.87 | 14.05 | 67.55 | 41.7 | 6,517.71 |
| 10-Jan-16 | 67.02 | 12.25 | 57.84 | 37.4 | 6,038.03 |
| 17-Jan-16 | 54.05 | 9.7 | 45.8 | 34 | 5,459.84 |
| 24-Jan-16 | 59.93 | 10.35 | 47.07 | 38.6 | 5,698.56 |
| 31-Jan-16 | 66.53 | 11.4 | 55.09 | 41.1 | 5,927.36 |
| 7-Feb-16 | 64.82 | 11.65 | 52.35 | 42.5 | 5,832.92 |
| 14-Feb-16 | 62.13 | 11.2 | 39.89 | 41 | 5,801.65 |
| 21-Feb-16 | 66.28 | 11.3 | 40.74 | 41.8 | 5,942.28 |
| 28-Feb-16 | 68.24 | 11.95 | 42 | 42.8 | 6,170.16 |
| 6-Mar-16 | 67.51 | 12.35 | 47.07 | 44.5 | 6,370.37 |
| 13-Mar-16 | 76.07 | 12.8 | 49.39 | 44 | 6,305.78 |
| 20-Mar-16 | 72.15 | 13.35 | 49.18 | 43 | 6,460.98 |
| 27-Mar-16 | 68 | 13.25 | 50.66 | 41 | 6,215.65 |
| 3-Apr-16 | 64.33 | 13.9 | 43.27 | 41.8 | 6,213.58 |
| 10-Apr-16 | 66.04 | 14.5 | 47.7 | 44.5 | 6,442.04 |
| 17-Apr-16 | 66.77 | 14.95 | 47.07 | 47.5 | 6,512.43 |
| 24-Apr-16 | 69.95 | 15.05 | 53.61 | 49.1 | 6,820.30 |
| 1-May-16 | 67.26 | 14 | 57.84 | 48 | 6,586.50 |
| 8-May-16 | 71.18 | 13.55 | 61.64 | 50.5 | 6,654.20 |
| 15-May-16 | 68.97 | 14.2 | 58.68 | 51 | 6,737.40 |
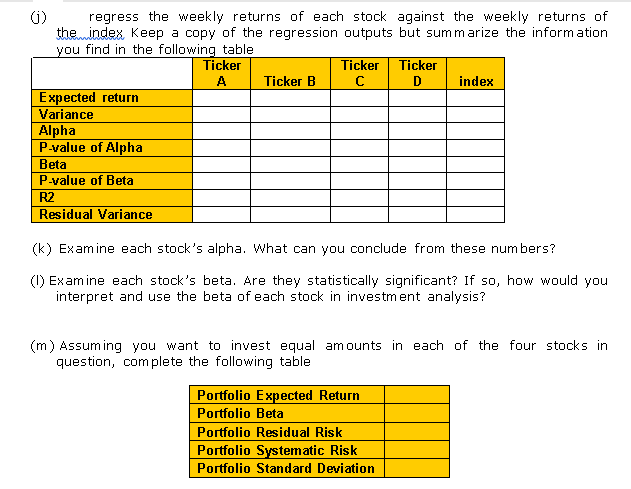
() regress the weekly returns of each stock against the weekly returns of the mindex Keep a copy of the regression outputs but summarize the information you find in the following table Ticker Ticker Ticker A Ticker B D index Expected return Variance Alpha P-value of Alpha Beta P-value of Beta R2 Residual Variance (k) Examine each stock's alpha. What can you conclude from these numbers? (1) Examine each stock's beta. Are they statistically significant? If so, how would you interpret and use the beta of each stock in investment analysis? (m) Assuming you want to invest equal amounts in each of the four stocks in question, complete the following table Portfolio Expected Return Portfolio Beta Portfolio Residual Risk Portfolio Systematic Risk Portfolio Standard Deviation () regress the weekly returns of each stock against the weekly returns of the mindex Keep a copy of the regression outputs but summarize the information you find in the following table Ticker Ticker Ticker A Ticker B D index Expected return Variance Alpha P-value of Alpha Beta P-value of Beta R2 Residual Variance (k) Examine each stock's alpha. What can you conclude from these numbers? (1) Examine each stock's beta. Are they statistically significant? If so, how would you interpret and use the beta of each stock in investment analysis? (m) Assuming you want to invest equal amounts in each of the four stocks in question, complete the following table Portfolio Expected Return Portfolio Beta Portfolio Residual Risk Portfolio Systematic Risk Portfolio Standard Deviation
Step by Step Solution
There are 3 Steps involved in it

Get step-by-step solutions from verified subject matter experts