

Question: Table 1 shows the results obtained by a student who performed an experiment to investigate how the length of a spring varies with the
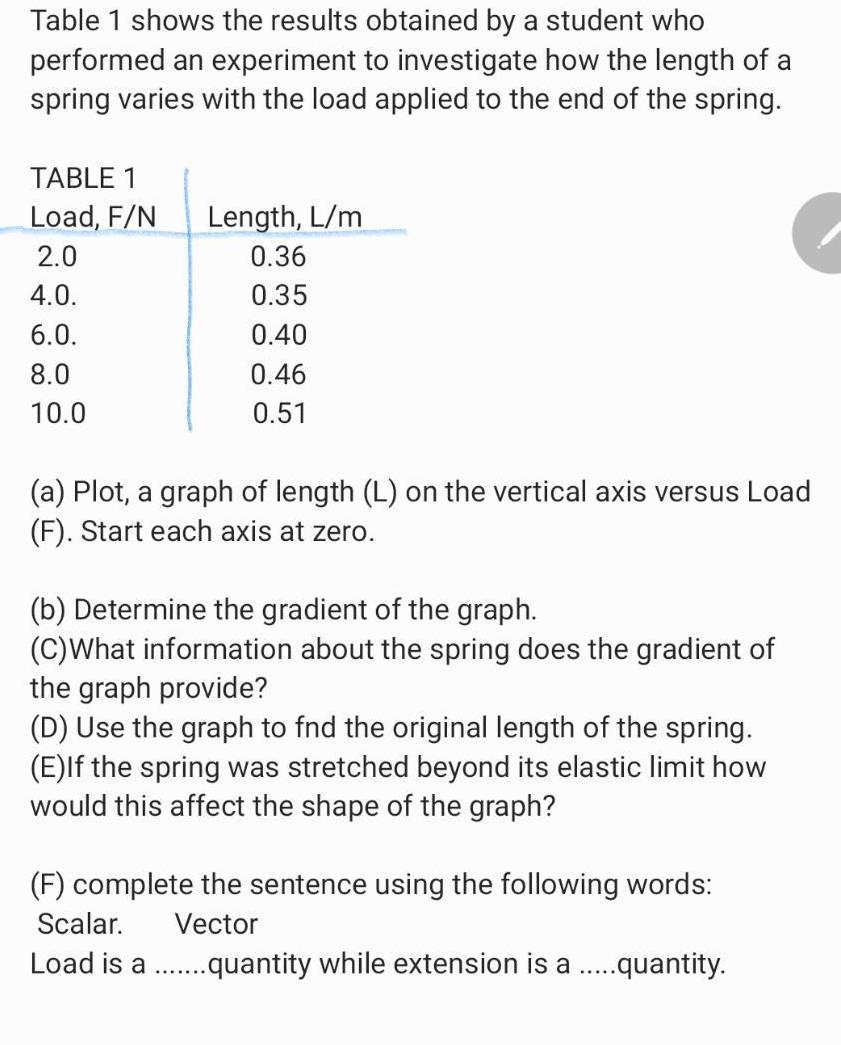
Table 1 shows the results obtained by a student who performed an experiment to investigate how the length of a spring varies with the load applied to the end of the spring. TABLE 1 Load, F/N Length, L/m 2.0 0.36 4.0. 0.35 6.0. 0.40 8.0 0.46 10.0 0.51 (a) Plot, a graph of length (L) on the vertical axis versus Load (F). Start each axis at zero. (b) Determine the gradient of the graph. (C)What information about the spring does the gradient of the graph provide? (D) Use the graph to fnd the original length of the spring. (E)lf the spring was stretched beyond its elastic limit how would this affect the shape of the graph? (F) complete the sentence using the following words: Scalar. Vector Load is a ..quantity while extension is a .quantity. .....
Step by Step Solution
3.43 Rating (153 Votes )
There are 3 Steps involved in it

Get step-by-step solutions from verified subject matter experts
Document Format (2 attachments)
60952b6a5f06f_211101.pdf
180 KBs PDF File
60952b6a5f06f_211101.docx
120 KBs Word File