

Question: A car is timed going down a track. Table 1 shows the distance the car is from the start line after it initially takes off.
A car is timed going down a track. Table 1 shows the distance the car is from the start line after it initially takes off. Table 2 shows the distance the car is from the finish line after it crosses the line and eventually comes to a stop.
|
|
7) Describe the behavior of the function in Table 1:
A. The function is increasing, and the rates of change are decreasing.
B. The function is decreasing, and the rates of change are increasing.
C. The function is decreasing, and the rates of change are decreasing.
D. The function is increasing, and the rates of change are increasing.
E. None of the above.
8) Describe the behavior of the function in Table 2:
A. The function is decreasing, and the rates of change are increasing.
B. The function is increasing, and the rates of change are increasing.
C. The function is increasing, and the rates of change are decreasing.
D. The function is decreasing, and the rates of change are decreasing.
E. None of the above.
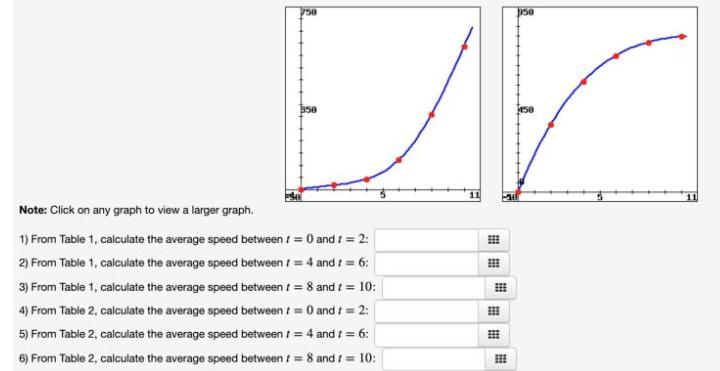
758 ase 358 Jese Note: Click on any graph to view a larger graph. 1) From Table 1, calculate the average speed between i = 0 and i = 2: 2) From Table 1, calculate the average speed between / = 4 and t= 6: 3) From Table 1, calculate the average speed between / = 8 and t = 10: 4) From Table 2, calculate the average speed between t = 0 and t = 2: 5) From Table 2, calculate the average speed between t = 4 and t = 6: 6) From Table 2, calculate the average speed between t = 8 and t= 10:
Step by Step Solution
3.41 Rating (151 Votes )
There are 3 Steps involved in it
1 From Table 1 calculate the average speed between t 0 and t 2 2 From Table 1 calculate the average ... View full answer

Get step-by-step solutions from verified subject matter experts