

Question: Graph a Long Run Phillips Curve and Short Run Phillips curve using the Hypothetical Data set. Hypothetical Data for the Future U.S. Economy Year Real
Graph a Long Run Phillips Curve and Short Run Phillips curve using the Hypothetical Data set.
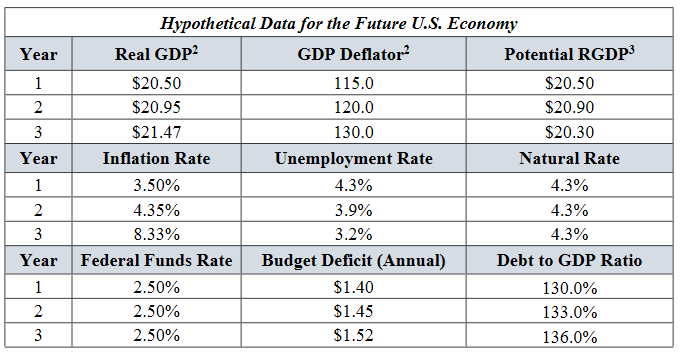
Hypothetical Data for the Future U.S. Economy Year Real GDP- GDP Deflator Potential RGDP3 $20.50 115.0 $20.50 2 $20.95 120.0 $20.90 3 $21.47 130.0 $20.30 Year Inflation Rate Unemployment Rate Natural Rate 3.50% 4.3% 4.3% 2 4.35% 3.9% 4.3% 3 8.33% 3.2% 4.3% Year Federal Funds Rate Budget Deficit (Annual) Debt to GDP Ratio 2.50% $1.40 130.0% 2 2.50% $1.45 133.0% 2.50% $1.52 136.0%
Step by Step Solution
There are 3 Steps involved in it
1 Expert Approved Answer
Step: 1 Unlock

Question Has Been Solved by an Expert!
Get step-by-step solutions from verified subject matter experts
Step: 2 Unlock
Step: 3 Unlock