

Question: graph description for the specific heat vs temperature equilibrium 10 23 249 -219 1 21 30 17 15 SHa 1000 1000 1000 1000 1000 2000
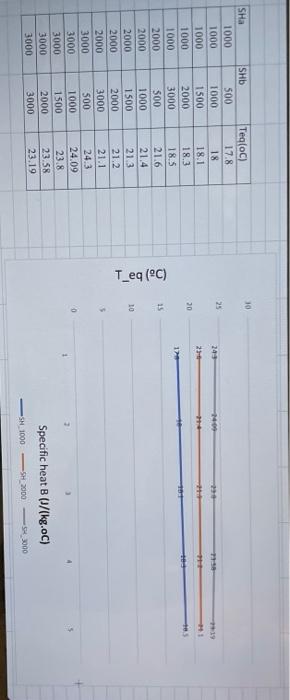
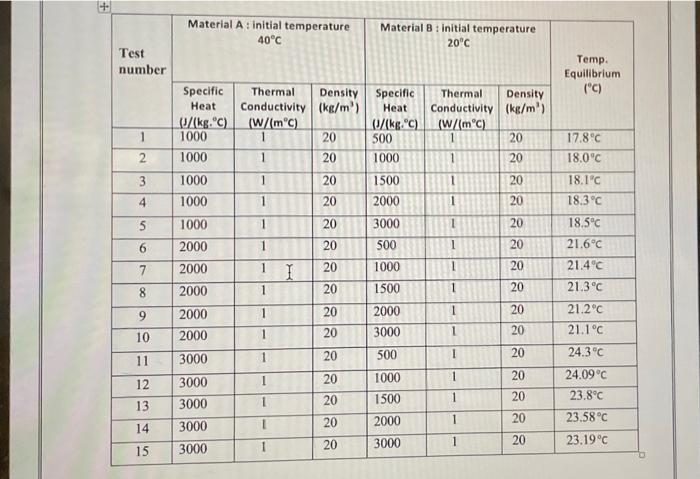
10 23 249 -219 1 21 30 17 15 SHa 1000 1000 1000 1000 1000 2000 2000 2000 2000 2000 3000 3000 3000 3000 3000 SHE 500 1000 1500 2000 3000 500 1000 1500 2000 3000 500 1000 1500 2000 3000 Tegloc) 17.8 18 18.1 18.3 18.5 21.6 21.4 21.3 21.2 21.1 243 24.09 23.8 23.58 23.19 Teq (C) 10 2 Specific heat B (J/(kg.oC) SH.1000-SH_2000 - 3000 Material A : initial temperature 40C Material : Initial temperature 20C Test number Temp. Equilibrium (C) Specific Heat /(kg.) 1000 1000 1000 Thermal Density Conductivity (kg/m') (W/(mc) 20 Thermal Density Conductivity (kg/m') (W/(mC) 20 1 17.8C Specific Heat (/(kg.) 500 1000 1500 2000 2 1 20 20 18.0C 3 20 20 20 4 20 5 20 20 6 18.1C 18.3C 18.5C 21.6C 21.4C 21.3C 20 3000 500 1000 1000 1000 2000 2000 2000 2000 1 20 7 20 20 1 8 20 1500 1 20 1 9 20 20 2000 21.2c 2000 1 10 3000 1 20 20 20 1 500 1 11 20 1 20 1 12 20 3000 3000 3000 3000 21.1C 24.3C 24.09C 23.8C 23.58C 23.19C 1 20 13 1000 1500 2000 3000 20 20 20 1 20 14 1 20 15 3000
Step by Step Solution
There are 3 Steps involved in it

Get step-by-step solutions from verified subject matter experts