

Question: GRAPH Regular Monopoly Natural Monopoly . . .. Show Deadweight Loss Off Show Economic Profit/Loss O off ($) Price, Average/Marginal Cost 225 200 175 150
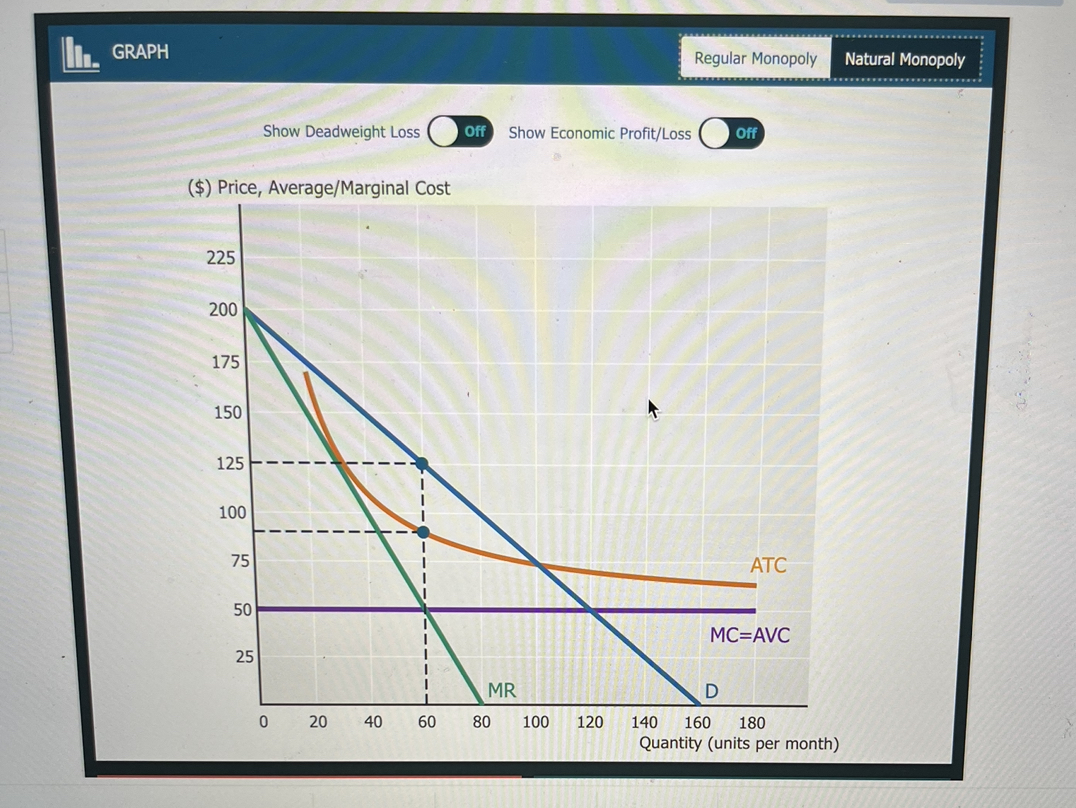
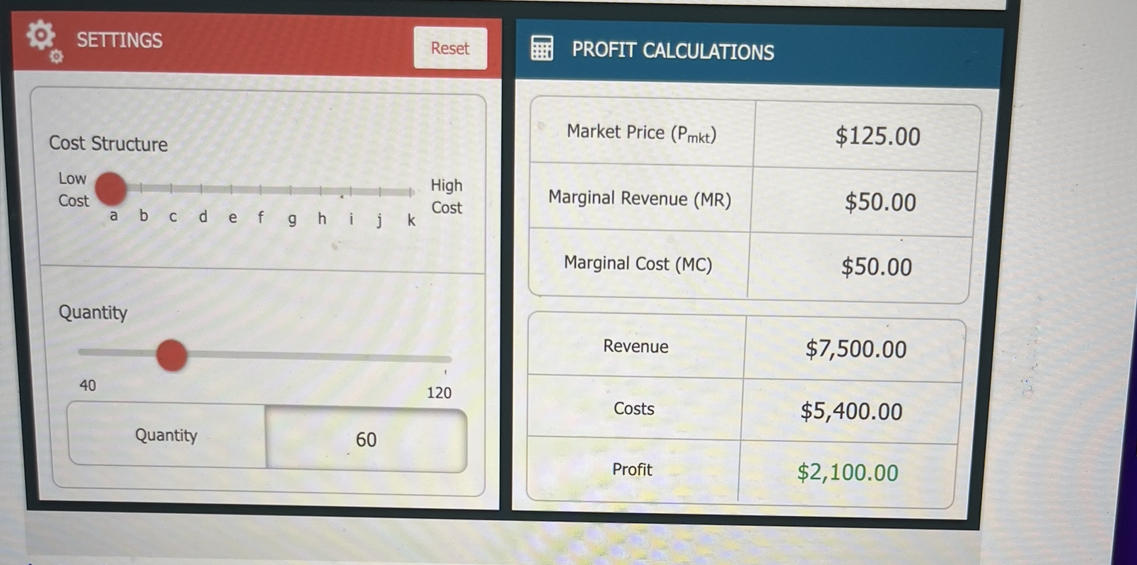
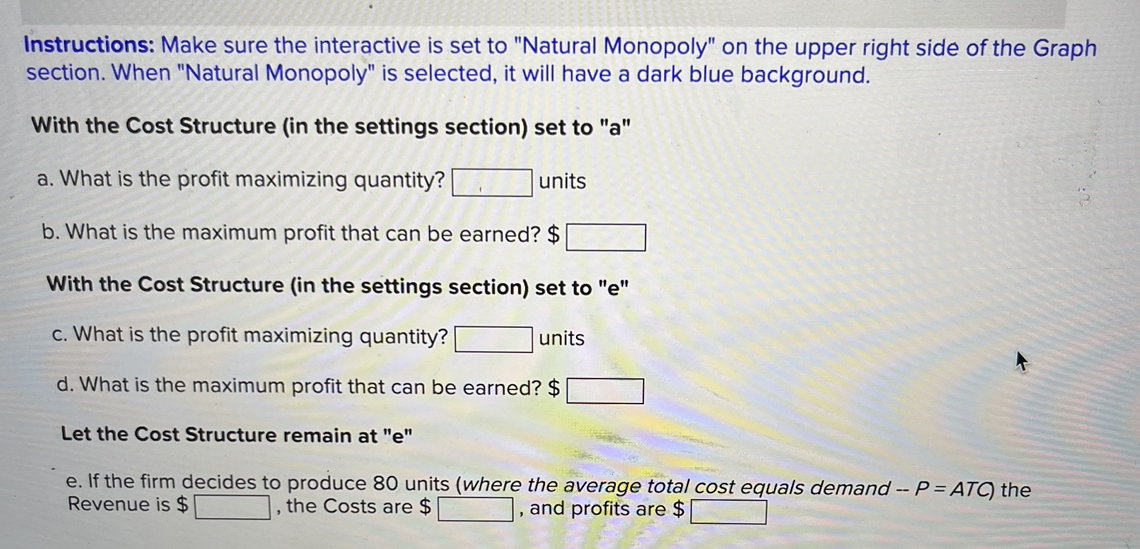
GRAPH Regular Monopoly Natural Monopoly . . .. Show Deadweight Loss Off Show Economic Profit/Loss O off ($) Price, Average/Marginal Cost 225 200 175 150 125 100 75 ATC 50 MC=AVC 25 MR D 0 20 40 60 80 100 120 140 160 180 Quantity (units per month)SETTINGS Reset PROFIT CALCULATIONS Market Price (Pmkt) $125.00 Cost Structure Low High Marginal Revenue (MR) $50.00 Cost Cost abcdefghij k Marginal Cost (MC) $50.00 Quantity Revenue $7,500.00 40 120 Costs $5,400.00 Quantity 60 Profit $2,100.00Instructions: Make sure the interactive is set to "Natural Monopoly" on the upper right side of the Graph section. When "Natural Monopoly" is selected, it will have a dark blue background. With the Cost Structure (in the settings section) set to "a" a. What is the profit maximizing quantity? units b. What is the maximum profit that can be earned? $ With the Cost Structure (in the settings section) set to "e" c. What is the profit maximizing quantity? units d. What is the maximum profit that can be earned? $ Let the Cost Structure remain at "e" e. If the firm decides to produce 80 units (where the average total cost equals demand -- P = ATC) the Revenue is $ , the Costs are $ , and profits are $
Step by Step Solution
There are 3 Steps involved in it

Get step-by-step solutions from verified subject matter experts