

Question: Graph the stock mean-return against its beta. (Beta on horizontal axis) begin{tabular}{|l|r|r|r|r|r|} hline & JNJ & DIS & KO & WMT & AGG hline
Graph the stock mean-return against its beta. (Beta on horizontal axis)
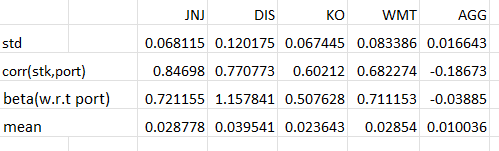
\begin{tabular}{|l|r|r|r|r|r|} \hline & JNJ & DIS & KO & WMT & AGG \\ \hline std & 0.068115 & 0.120175 & 0.067445 & 0.083386 & 0.016643 \\ \hline corr(stk,port) & 0.84698 & 0.770773 & 0.60212 & 0.682274 & -0.18673 \\ \hline beta(w.r.t port) & 0.721155 & 1.157841 & 0.507628 & 0.711153 & -0.03885 \\ \hline mean & 0.028778 & 0.039541 & 0.023643 & 0.02854 & 0.010036 \\ \hline \end{tabular}
Step by Step Solution
There are 3 Steps involved in it
1 Expert Approved Answer
Step: 1 Unlock

Question Has Been Solved by an Expert!
Get step-by-step solutions from verified subject matter experts
Step: 2 Unlock
Step: 3 Unlock