

Question: Graphical analysis, in exercises 11-16, determine whether the graph could represent a variable with a normal distribution. Explain the reasoning, If the graph appears to
Graphical analysis, in exercises 11-16, determine whether the graph could represent a variable with a normal distribution. Explain the reasoning, If the graph appears to represent a normal distribution, estimate the mean and standard deviation.
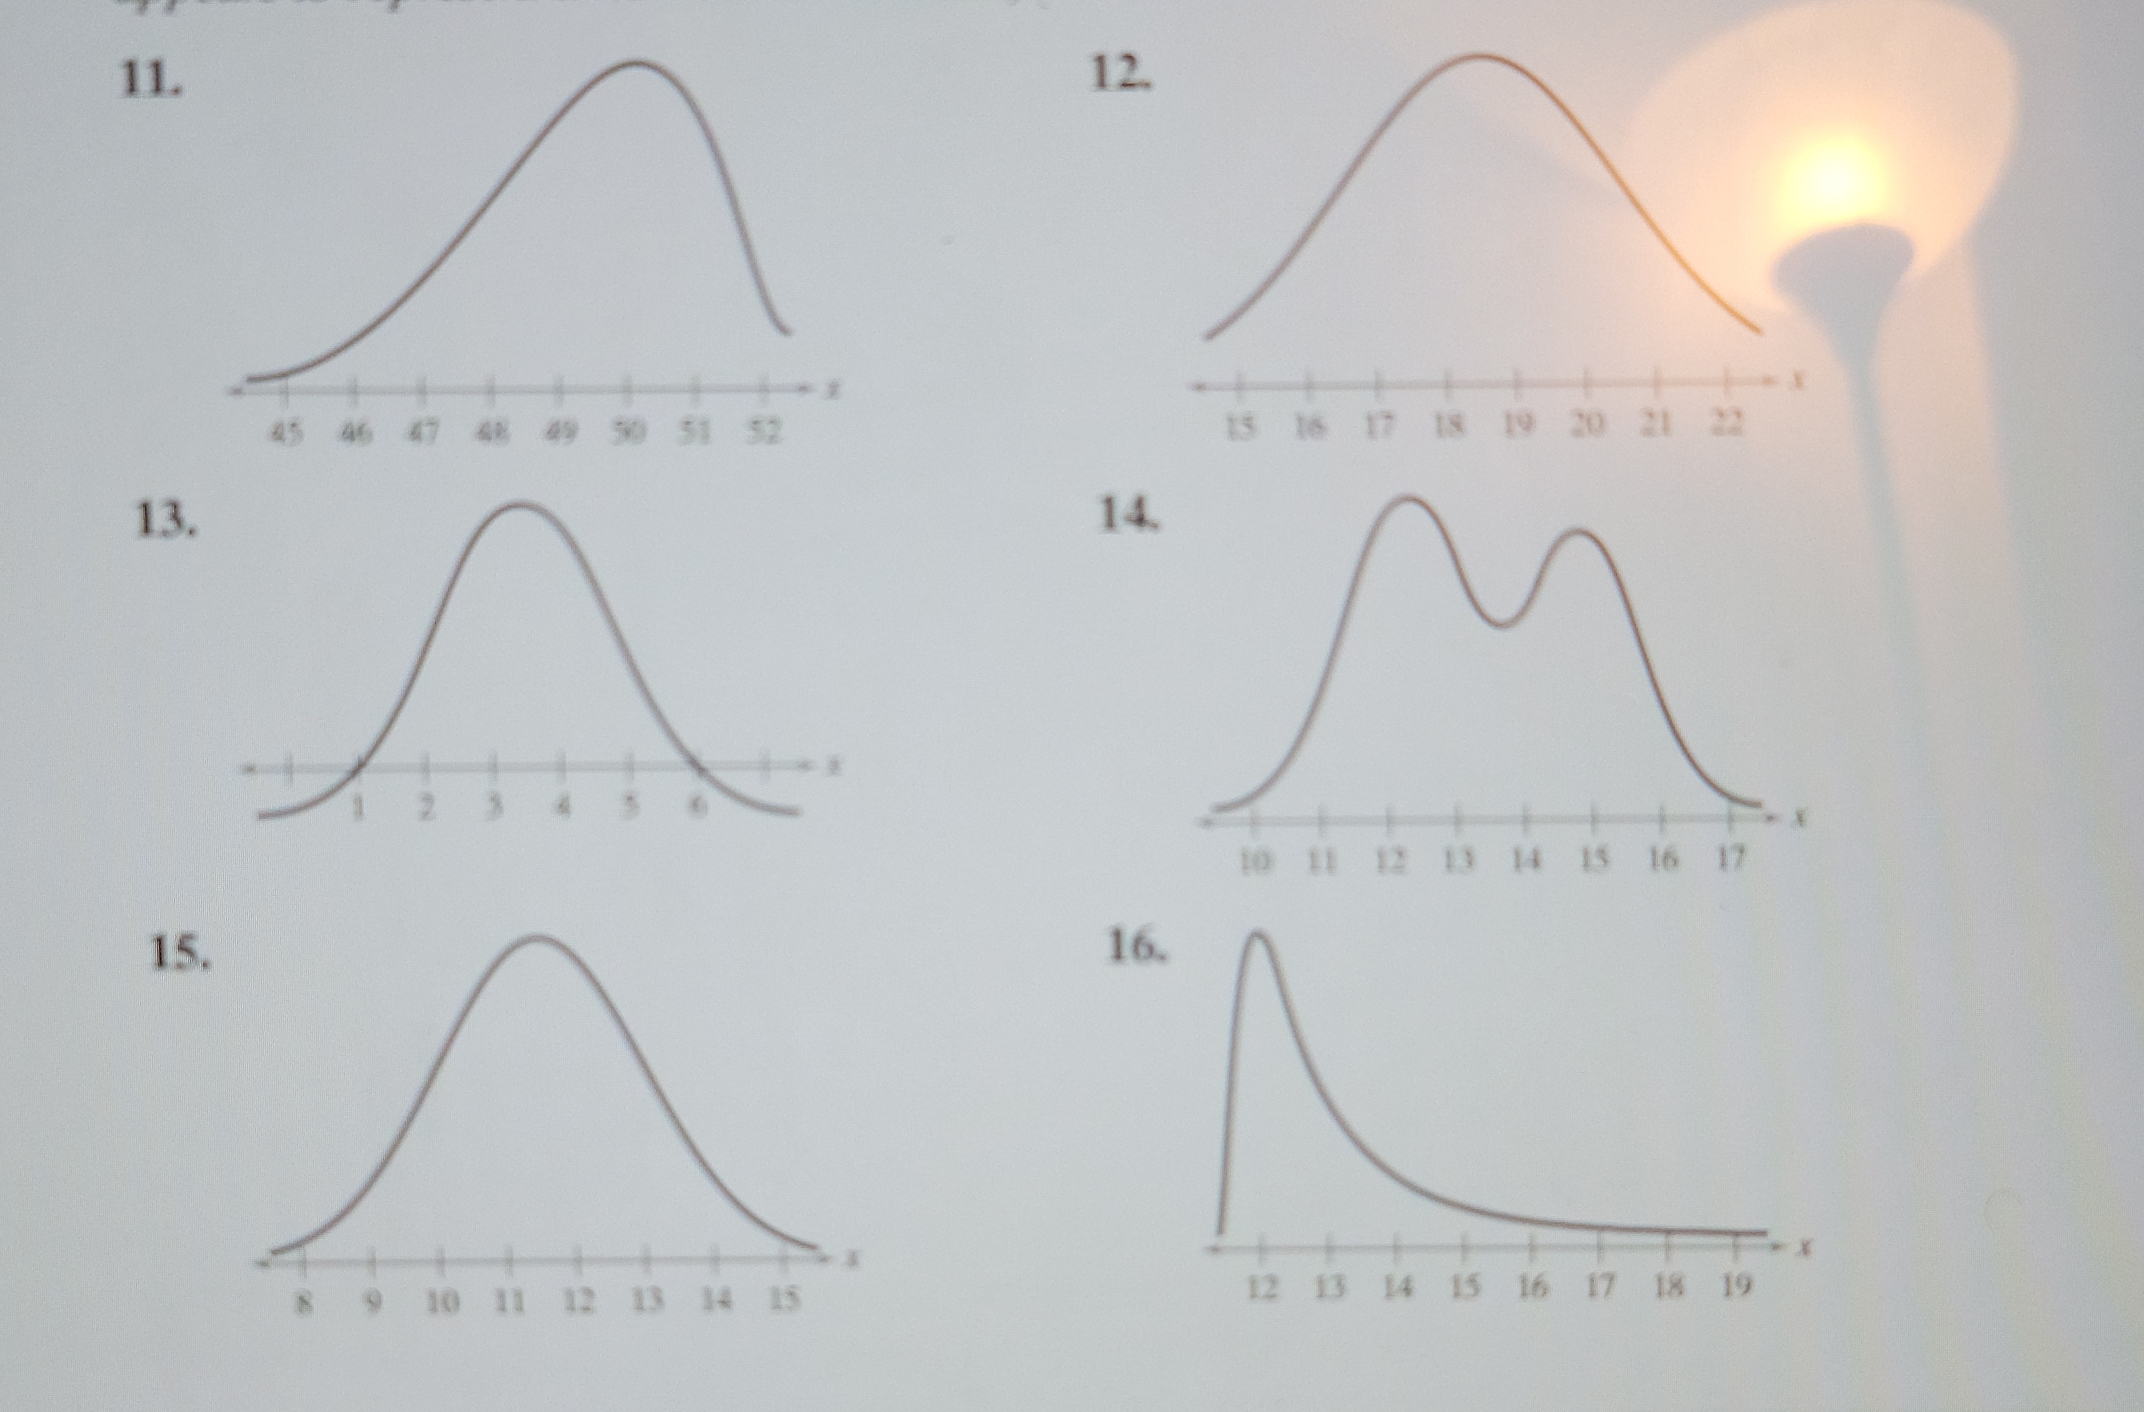
11. 12. 45 46 47 48 89 50 51 52 15 16 17 18 19 20 21 22 13. 14. 10 11 12 13 14 15 16 17 15. 16. 9 10 11 12 13 14 15 12 13 14 15 16 17 18 19
Step by Step Solution
There are 3 Steps involved in it
1 Expert Approved Answer
Step: 1 Unlock

Question Has Been Solved by an Expert!
Get step-by-step solutions from verified subject matter experts
Step: 2 Unlock
Step: 3 Unlock