

Question: Determine whether the graph could represent a variable with a normal distribution. Explain your reasoning. If the graph appears to represent a normal distribution, estimate
Determine whether the graph could represent a variable with a normal distribution. Explain your reasoning. If the graph appears to represent a normal distribution, estimate the mean and standard deviation.
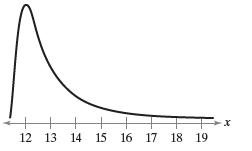
12 13 14 15 16 17 18 19
Step by Step Solution
★★★★★
3.45 Rating (165 Votes )
There are 3 Steps involved in it
1 Expert Approved Answer
Step: 1 Unlock

No the ... View full answer
Question Has Been Solved by an Expert!
Get step-by-step solutions from verified subject matter experts
Step: 2 Unlock
Step: 3 Unlock