

Question: Graphing Assignment #1 You are writing a paper for your International Marketing class and have come across the following information that you will include in
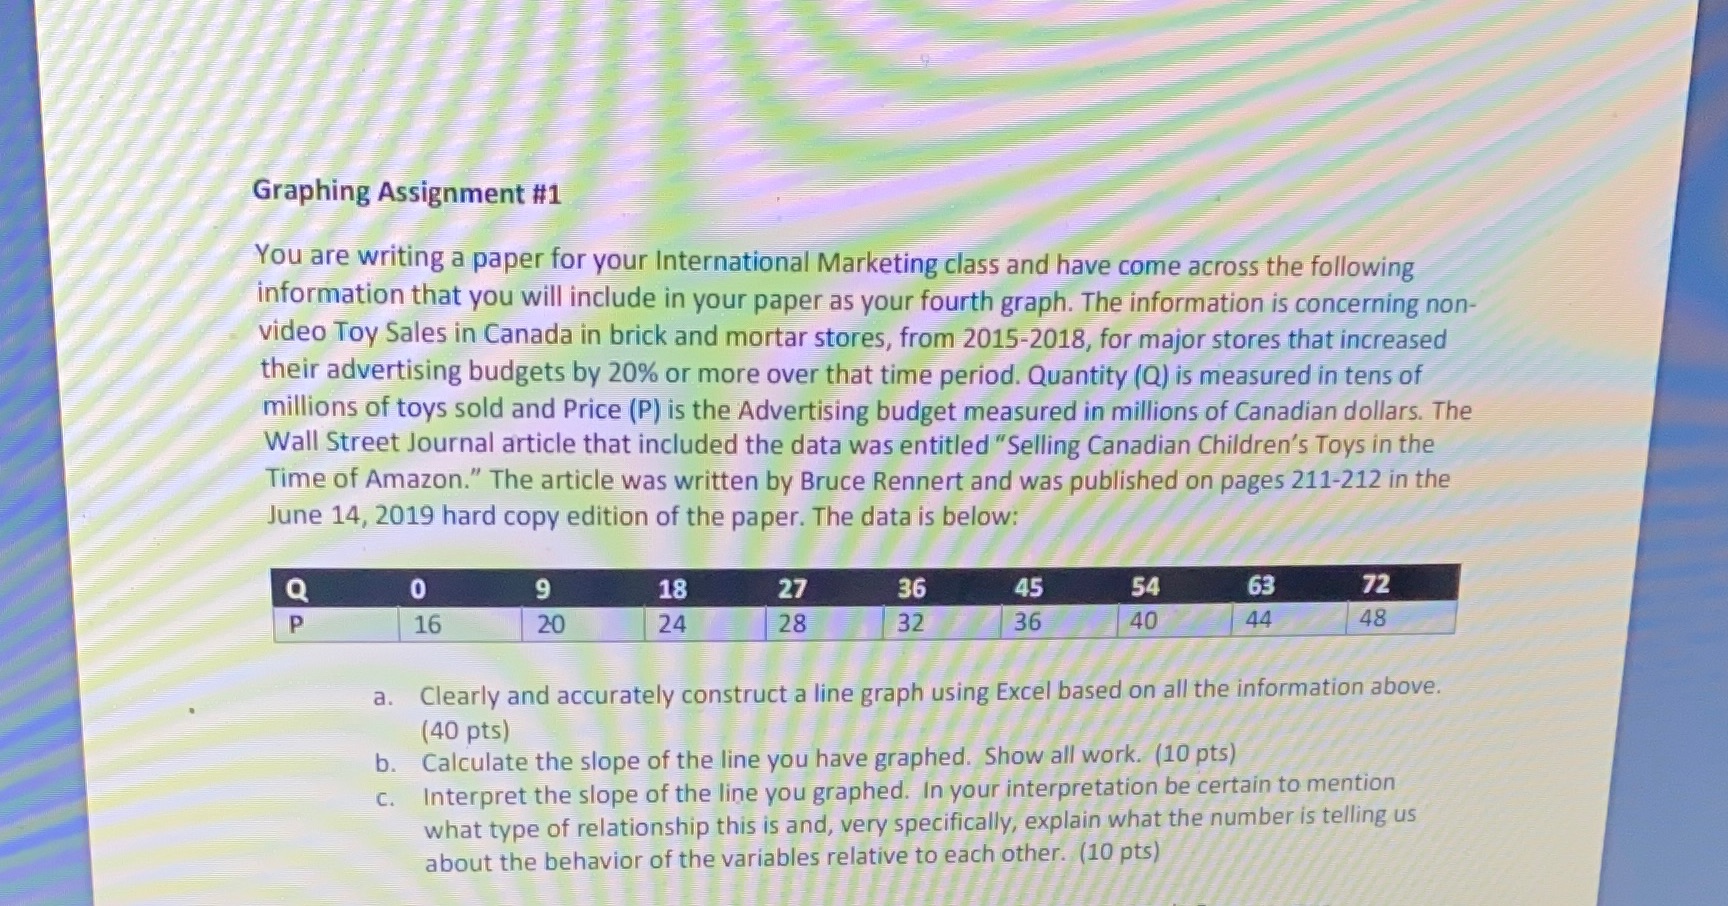

Graphing Assignment #1 You are writing a paper for your International Marketing class and have come across the following information that you will include in your paper as your fourth graph. The information is concerning non- video Toy Sales in Canada in brick and mortar stores, from 2015-2018, for major stores that increased their advertising budgets by 20% or more over that time period. Quantity (Q) is measured in tens of millions of toys sold and Price (P) is the Advertising budget measured in millions of Canadian dollars. The Wall Street Journal article that included the data was entitled "Selling Canadian Children's Toys in the Time of Amazon." The article was written by Bruce Rennert and was published on pages 211-212 in the June 14, 2019 hard copy edition of the paper. The data is below: Q 9 18 27 36 45 54 63 72 P 16 20 24 28 32 36 40 44 48 a. Clearly and accurately construct a line graph using Excel based on all the information above. (40 pts) b. Calculate the slope of the line you have graphed. Show all work. (10 pts) C. Interpret the slope of the line you graphed. In your interpretation be certain to mention what type of relationship this is and, very specifically, explain what the number is telling us about the behavior of the variables relative to each other. (10 pts)
Step by Step Solution
There are 3 Steps involved in it

Get step-by-step solutions from verified subject matter experts