

Question: You are writing a paper for your Quantitative Analysis class and have come across the following information that you will include in your paper as
You are writing a paper for your Quantitative Analysis class and have come across the following information that you will include in your paper as your second graph. The information is concerning high end auto tire sales in Canada from 2016-2021. Quantity (Q) is measured in tens of thousands of tires sold and Price (P) is the price of each tire measured in tens of Canadian dollars. The Wall Street Journal article that included the data was entitled Selling Canadian Tires.
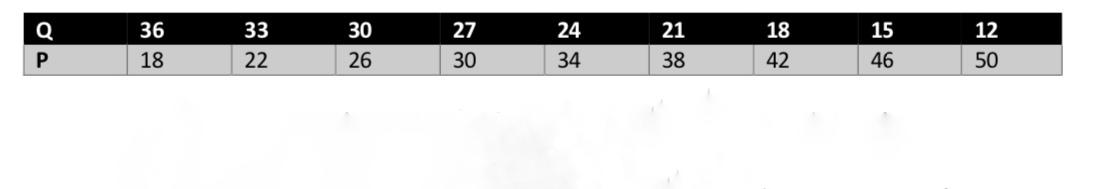
1....Clearly and accurately construct a line graph using Excel based on all the information above.
2... Calculate the slope of the line you have graphed. Show all work.
3.... Interpret the slope of the line you graphed. In your interpretation be certain to mention what type of relationship this is and, very specifically, explain what the number is telling us
about the behavior of the variables relative to each other.
Step by Step Solution
There are 3 Steps involved in it

Get step-by-step solutions from verified subject matter experts