

Question: (GROUPED DATA AND UNGROUPED DATA) 1. The data shown below presents the lifetime of 50 fruit flies after being sprayed by an insecticide. a. Construct
(GROUPED DATA AND UNGROUPED DATA)
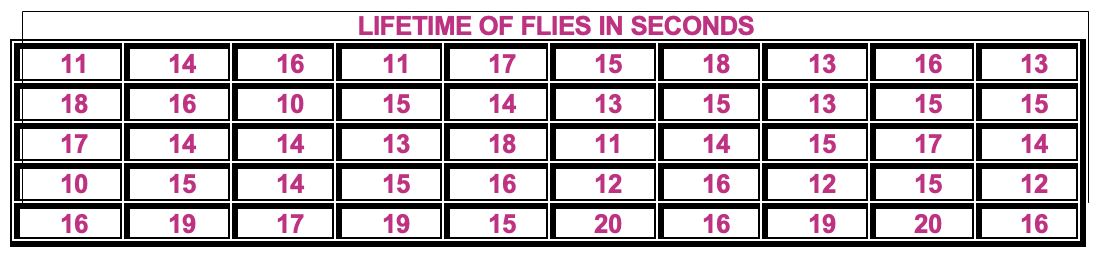
1. The data shown below presents the lifetime of 50 fruit flies after being sprayed by an insecticide.
a. Construct a frequency distribution table showing the following information: frequency, cumulative frequency, relative frequency, cumulative relative frequency
b. Determine the mean, median, and mode.
c. What percentage of the fruit flies had a lifetime of at least 18 seconds?
d. How many fruit flies had a lifetime of less than 15 seconds?
\f
Step by Step Solution
There are 3 Steps involved in it
1 Expert Approved Answer
Step: 1 Unlock

Question Has Been Solved by an Expert!
Get step-by-step solutions from verified subject matter experts
Step: 2 Unlock
Step: 3 Unlock