

Question: grouped Data lable and Statistics Use the bins and frequencies of the grouped set of data in the table below to answer question 7, 8,

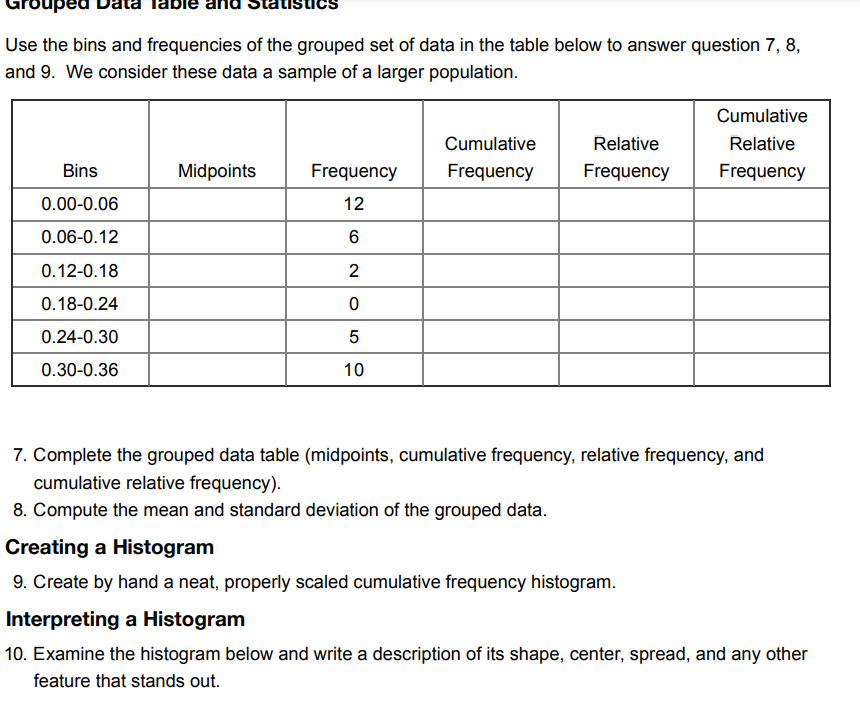
grouped Data lable and Statistics Use the bins and frequencies of the grouped set of data in the table below to answer question 7, 8, and 9. We consider these data a sample of a larger population. Cumulative Cumulative Relative Relative Bins Midpoints Frequency Frequency Frequency Frequency 0.00-0.06 12 0.06-0.12 6 0. 12-0.18 2 0.18-0.24 0 0.24-0.30 5 0.30-0.36 10 7. Complete the grouped data table (midpoints, cumulative frequency, relative frequency, and cumulative relative frequency). 8. Compute the mean and standard deviation of the grouped data. Creating a Histogram 9. Create by hand a neat, properly scaled cumulative frequency histogram. Interpreting a Histogram 10. Examine the histogram below and write a description of its shape, center, spread, and any other feature that stands out
Step by Step Solution
There are 3 Steps involved in it

Get step-by-step solutions from verified subject matter experts