

Guidance for Company Report 1. To which industry/sector does this company belong? What are the major...
Fantastic news! We've Found the answer you've been seeking!
Question:
Transcribed Image Text:
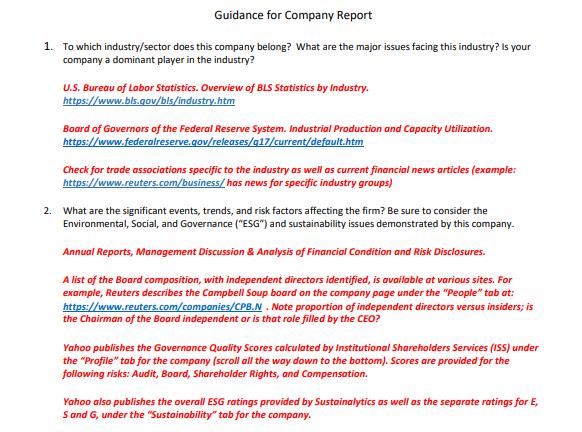
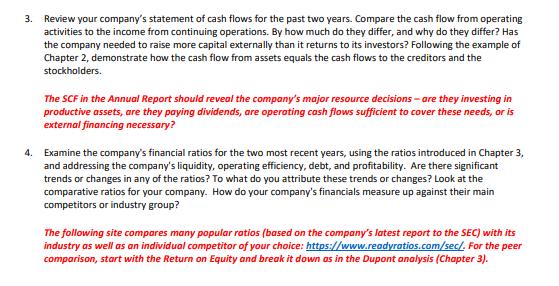
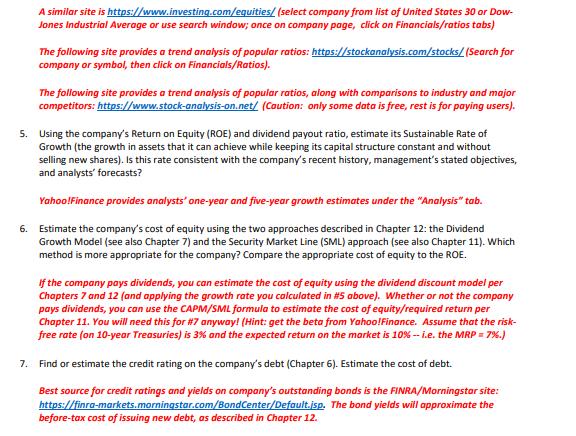
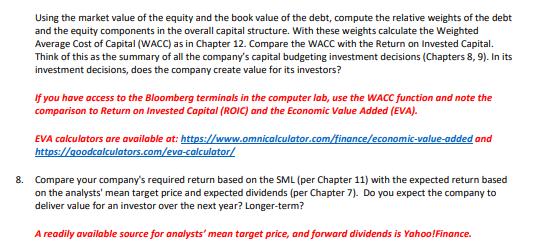
Guidance for Company Report 1. To which industry/sector does this company belong? What are the major issues facing this industry? Is your company a dominant player in the industry? U.S. Bureau of Labor Statistics. Overview of BLS Statistics by Industry. https://www.bls.gov/bls/industry.htm Board of Governors of the Federal Reserve System. Industrial Production and Capacity Utilization. https://www.federalreserve.gov/releases/q17/current/default.htm Check for trade associations specific to the industry as well as current financial news articles (example: https://www.reuters.com/business/has news for specific industry groups) 2. What are the significant events, trends, and risk factors affecting the firm? Be sure to consider the Environmental, Social, and Governance ("ESG") and sustainability issues demonstrated by this company. Annual Reports, Management Discussion & Analysis of Financial Condition and Risk Disclosures. A list of the Board composition, with independent directors identified, is available at various sites. For example, Reuters describes the Campbell Soup board on the company page under the "People" tab at: https://www.reuters.com/companies/CPB.N. Note proportion of independent directors versus insiders; is the Chairman of the Board independent or is that role filled by the CEO? Yahoo publishes the Governance Quality Scores calculated by Institutional Shareholders Services (ISS) under the "Profile" tab for the company (scroll all the way down to the bottom). Scores are provided for the following risks: Audit, Board, Shareholder Rights, and Compensation. Yahoo also publishes the overall ESG ratings provided by Sustainalytics as well as the separate ratings for E, S and G, under the "Sustainability" tab for the company. 3. Review your company's statement of cash flows for the past two years. Compare the cash flow from operating activities to the income from continuing operations. By how much do they differ, and why do they differ? Has the company needed to raise more capital externally than it returns to its investors? Following the example of Chapter 2, demonstrate how the cash flow from assets equals the cash flows to the creditors and the stockholders. The SCF in the Annual Report should reveal the company's major resource decisions are they investing in productive assets, are they paying dividends, are operating cash flows sufficient to cover these needs, or is external financing necessary? 4. Examine the company's financial ratios for the two most recent years, using the ratios introduced in Chapter 3, and addressing the company's liquidity, operating efficiency, debt, and profitability. Are there significant trends or changes in any of the ratios? To what do you attribute these trends or changes? Look at the comparative ratios for your company. How do your company's financials measure up against their main competitors or industry group? The following site compares many popular ratios (based on the company's latest report to the SEC) with its industry as well as an individual competitor of your choice: https://www.readyratios.com/sec/. For the peer comparison, start with the Return on Equity and break it down as in the Dupont analysis (Chapter 3). A similar site is https://www.investing.com/equities/ (select company from list of United States 30 or Dow- Jones Industrial Average or use search window; once on company page, click on Financials/ratios tabs) The following site provides a trend analysis of popular ratios: https://stockanalysis.com/stocks/(Search for company or symbol, then click on Financials/Ratios). The following site provides a trend analysis of popular ratios, along with comparisons to industry and major competitors: https://www.stock-analysis-on.net/ (Caution: only some data is free, rest is for paying users). 5. Using the company's Return on Equity (ROE) and dividend payout ratio, estimate its Sustainable Rate of Growth (the growth in assets that it can achieve while keeping its capital structure constant and without selling new shares). Is this rate consistent with the company's recent history, management's stated objectives, and analysts' forecasts? Yahoo!Finance provides analysts' one-year and five-year growth estimates under the "Analysis" tab. 6. Estimate the company's cost of equity using the two approaches described in Chapter 12: the Dividend Growth Model (see also Chapter 7) and the Security Market Line (SML) approach (see also Chapter 11). Which method is more appropriate for the company? Compare the appropriate cost of equity to the ROE. If the company pays dividends, you can estimate the cost of equity using the dividend discount model per Chapters 7 and 12 (and applying the growth rate you calculated in #5 above). Whether or not the company pays dividends, you can use the CAPM/SML formula to estimate the cost of equity/required return per Chapter 11. You will need this for #7 anyway! (Hint: get the beta from Yahoo!Finance. Assume that the risk- free rate (on 10-year Treasuries) is 3% and the expected return on the market is 10%-- i.e. the MRP = 7%.) 7. Find or estimate the credit rating on the company's debt (Chapter 6). Estimate the cost of debt. Best source for credit ratings and yields on company's outstanding bonds is the FINRA/Morningstar site: https://finra-markets.morningstar.com/BondCenter/Default.jsp. The bond yields will approximate the before-tax cost of issuing new debt, as described in Chapter 12. Using the market value of the equity and the book value of the debt, compute the relative weights of the debt and the equity components in the overall capital structure. With these weights calculate the Weighted Average Cost of Capital (WACC) as in Chapter 12. Compare the WACC with the Return on invested Capital. Think of this as the summary of all the company's capital budgeting investment decisions (Chapters 8, 9). In its investment decisions, does the company create value for its investors? If you have access to the Bloomberg terminals in the computer lab, use the WACC function and note the comparison to Return on Invested Capital (ROIC) and the Economic Value Added (EVA). EVA calculators are available at: https://www.omnicalculator.com/finance/economic-value-added and https://goodcalculators.com/eva-calculator/ 8. Compare your company's required return based on the SML (per Chapter 11) with the expected return based on the analysts' mean target price and expected dividends (per Chapter 7). Do you expect the company to deliver value for an investor over the next year? Longer-term? A readily available source for analysts' mean target price, and forward dividends is Yahoo!Finance. Guidance for Company Report 1. To which industry/sector does this company belong? What are the major issues facing this industry? Is your company a dominant player in the industry? U.S. Bureau of Labor Statistics. Overview of BLS Statistics by Industry. https://www.bls.gov/bls/industry.htm Board of Governors of the Federal Reserve System. Industrial Production and Capacity Utilization. https://www.federalreserve.gov/releases/q17/current/default.htm Check for trade associations specific to the industry as well as current financial news articles (example: https://www.reuters.com/business/has news for specific industry groups) 2. What are the significant events, trends, and risk factors affecting the firm? Be sure to consider the Environmental, Social, and Governance ("ESG") and sustainability issues demonstrated by this company. Annual Reports, Management Discussion & Analysis of Financial Condition and Risk Disclosures. A list of the Board composition, with independent directors identified, is available at various sites. For example, Reuters describes the Campbell Soup board on the company page under the "People" tab at: https://www.reuters.com/companies/CPB.N. Note proportion of independent directors versus insiders; is the Chairman of the Board independent or is that role filled by the CEO? Yahoo publishes the Governance Quality Scores calculated by Institutional Shareholders Services (ISS) under the "Profile" tab for the company (scroll all the way down to the bottom). Scores are provided for the following risks: Audit, Board, Shareholder Rights, and Compensation. Yahoo also publishes the overall ESG ratings provided by Sustainalytics as well as the separate ratings for E, S and G, under the "Sustainability" tab for the company. 3. Review your company's statement of cash flows for the past two years. Compare the cash flow from operating activities to the income from continuing operations. By how much do they differ, and why do they differ? Has the company needed to raise more capital externally than it returns to its investors? Following the example of Chapter 2, demonstrate how the cash flow from assets equals the cash flows to the creditors and the stockholders. The SCF in the Annual Report should reveal the company's major resource decisions are they investing in productive assets, are they paying dividends, are operating cash flows sufficient to cover these needs, or is external financing necessary? 4. Examine the company's financial ratios for the two most recent years, using the ratios introduced in Chapter 3, and addressing the company's liquidity, operating efficiency, debt, and profitability. Are there significant trends or changes in any of the ratios? To what do you attribute these trends or changes? Look at the comparative ratios for your company. How do your company's financials measure up against their main competitors or industry group? The following site compares many popular ratios (based on the company's latest report to the SEC) with its industry as well as an individual competitor of your choice: https://www.readyratios.com/sec/. For the peer comparison, start with the Return on Equity and break it down as in the Dupont analysis (Chapter 3). A similar site is https://www.investing.com/equities/ (select company from list of United States 30 or Dow- Jones Industrial Average or use search window; once on company page, click on Financials/ratios tabs) The following site provides a trend analysis of popular ratios: https://stockanalysis.com/stocks/(Search for company or symbol, then click on Financials/Ratios). The following site provides a trend analysis of popular ratios, along with comparisons to industry and major competitors: https://www.stock-analysis-on.net/ (Caution: only some data is free, rest is for paying users). 5. Using the company's Return on Equity (ROE) and dividend payout ratio, estimate its Sustainable Rate of Growth (the growth in assets that it can achieve while keeping its capital structure constant and without selling new shares). Is this rate consistent with the company's recent history, management's stated objectives, and analysts' forecasts? Yahoo!Finance provides analysts' one-year and five-year growth estimates under the "Analysis" tab. 6. Estimate the company's cost of equity using the two approaches described in Chapter 12: the Dividend Growth Model (see also Chapter 7) and the Security Market Line (SML) approach (see also Chapter 11). Which method is more appropriate for the company? Compare the appropriate cost of equity to the ROE. If the company pays dividends, you can estimate the cost of equity using the dividend discount model per Chapters 7 and 12 (and applying the growth rate you calculated in #5 above). Whether or not the company pays dividends, you can use the CAPM/SML formula to estimate the cost of equity/required return per Chapter 11. You will need this for #7 anyway! (Hint: get the beta from Yahoo!Finance. Assume that the risk- free rate (on 10-year Treasuries) is 3% and the expected return on the market is 10%-- i.e. the MRP = 7%.) 7. Find or estimate the credit rating on the company's debt (Chapter 6). Estimate the cost of debt. Best source for credit ratings and yields on company's outstanding bonds is the FINRA/Morningstar site: https://finra-markets.morningstar.com/BondCenter/Default.jsp. The bond yields will approximate the before-tax cost of issuing new debt, as described in Chapter 12. Using the market value of the equity and the book value of the debt, compute the relative weights of the debt and the equity components in the overall capital structure. With these weights calculate the Weighted Average Cost of Capital (WACC) as in Chapter 12. Compare the WACC with the Return on invested Capital. Think of this as the summary of all the company's capital budgeting investment decisions (Chapters 8, 9). In its investment decisions, does the company create value for its investors? If you have access to the Bloomberg terminals in the computer lab, use the WACC function and note the comparison to Return on Invested Capital (ROIC) and the Economic Value Added (EVA). EVA calculators are available at: https://www.omnicalculator.com/finance/economic-value-added and https://goodcalculators.com/eva-calculator/ 8. Compare your company's required return based on the SML (per Chapter 11) with the expected return based on the analysts' mean target price and expected dividends (per Chapter 7). Do you expect the company to deliver value for an investor over the next year? Longer-term? A readily available source for analysts' mean target price, and forward dividends is Yahoo!Finance.
Expert Answer:
Answer rating: 100% (QA)
COMPANY REPORTQ3 CASH FLOW Cash flow is the movement of money in and out of a firm or a company Cash received by the company signifies inflows while cash spent by the company signifies outflows The ca... View the full answer

Related Book For 
Business and society ethics and stakeholder management
ISBN: 978-0324569391
7th Edition
Authors: Archie B. Carroll, Ann K. Buchholtz
Posted Date:
Students also viewed these accounting questions
-
What are the major issues facing motor carriers as we approach the twenty first century? How should these issues be addressed?
-
What are the major issues in using per capita GDP or GNP as a country segmentation criterion?
-
What are the major issues in using per capita GDP or GNP as a country segmentation criterion?
-
A double-ended queue or deque (pronounced "deck") is a collection that is a combination of a stack and a queue. Write a class Deque that uses a linked list to implement the following API: public...
-
Roll Corporation (RC) currently has 330,000 shares of stock outstanding that sell for $64 per share. Assuming no market imperfections or tax effects exist, what will the share price be after? a. RC...
-
Calculate the radius of the cavity formed by three circular disks of radius r that lie in a close-packed planar arrangement. Check your answer experimentally by using three compact disks and...
-
Over the past several years. Hobble, Inc. has expanded, diversified, and grown both in sales and in profits. Two years ago Hobble's management established an internal audit department that is...
-
You are the Senior Accountant for the Patty Corporation, which has several divisions. They each keep their own accounting books and have chosen the appropriate method of revenue recognition based on...
-
Assume that you have received notice that you are being interviewed for that job. You now have to prepare for the upcoming interview. Part of your preparation is to plan for how you will respond to...
-
You have five 1.5 V cells. How would you connect all five of them to give an e.m.f. of: a. 7.5 V b. 1.5 V c. 4.5 V?
-
Show the data in all your tables in your project document (a clear and readable screen shot) Customer Order Order_line Product ProductLine The SQL command, The output , The number of rows affected....
-
Which accounting standard in Australia addresses the requirements for accounting for taxation? Ensure to identify and explain 3 steps to accounting for current and future tax consequences. Do not...
-
Simplify the following expressions: (x+1)(x+2)(x+1) (2x+1)(x-3)
-
Riviera Incorporated produces flat panel televisions. The company has annual fixed costs totaling $10,000,000 and variable costs of $600 per unit. Each unit of product is sold for $1,000. Riviera...
-
The inventory records of Boots Company showed the following data related to the sales of leather boots for June. Units Unit Price 01-Jun Opening inventory 2,880 $ 32.60 01-Jun Purchased 12,080 $...
-
1. The straight-line and accelerated depreciation methods differ significantly in the amount and timing of depreciation expense recognized and reported each year. Required: a. What is the difference...
-
A hacker's 'dictionary' contains 900,000 passwords which have been sold to her on the dark web. She also has gained knowledge of 300,000 usernames for a particular target site. She is going to try...
-
On average there are four traffic accidents in a city during one hour of rush-hour traffic. Use the Poisson distribution to calculate the probability that in one such hour there arc (a) No accidents...
-
1. What are the social and ethical issues in this case? Which are major and which are minor? 2. Who are the stakeholders and what are their stakes? Assess their legitimacy, power, and urgency. 3. Who...
-
1. What are the ethical issues in this case? 2. Do you think that either group, pro-GM or anti-GM foods, is correct while the other group is wrong? If so, what reasoning do you give for supporting...
-
1. What are the ethical issues in this case? 2. Who are the stakeholders impacted by this situation? How would you rank their claims? 3. What is your reaction to Richard Grassos compensation package?...
-
a. Using the DSA in Experiment 4A to generate open-loop Bode plots, what is the phase margin when the sample time is set to its default (0.00025 sec)? b. Repeat with a sample time of 0.0005 sec. c....
-
a. In Experiment 4A, set the sample frequency to 50 msec and measure the phase margin. b. Compare this with the phase margin with a 1-msec sample time (same as Question 1c). (DATA FROM QUETION 1C) c....
-
Assume that you have shorted the put option in Problem 4. a. If the stock is trading at \($8\) in three months, what will you owe? b. If the stock is trading at \($23\) in three months, what will you...

Study smarter with the SolutionInn App