Question: Guide me detail each formula (in which cell type which formula, data or value from ?hich cell to which cell) and expected result in each
Guide me detail each formula (in which cell type which formula, data or value from ?hich cell to which cell) and expected result in each step (both excel and minitab) _
The link to download data: https://www.abs.gov.au/statistics/industry/retail-and-wholesale-trade/retail-trade-australia/jun-2024/850101.xlsx
or
Table 1 in this page: https://www.abs.gov.au/statistics/industry/retail-and-wholesale-trade/retail-trade- australia/jun-2024#data-downloads
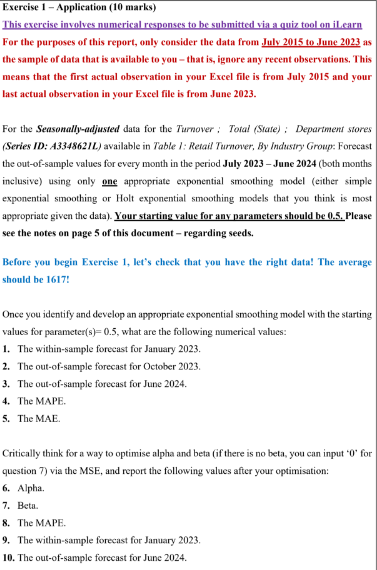
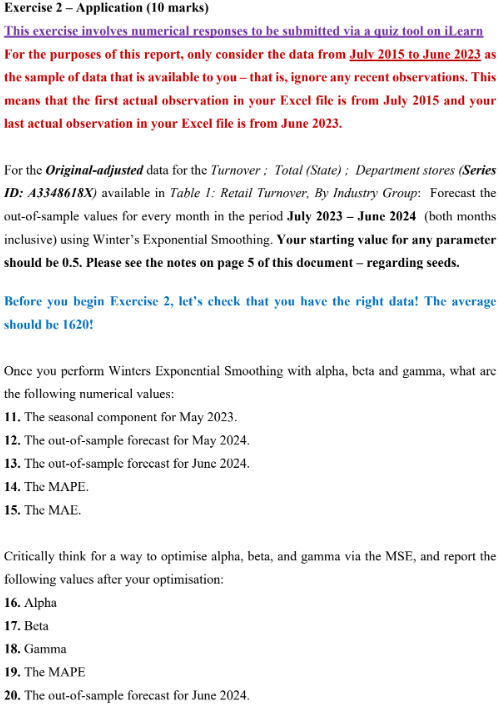
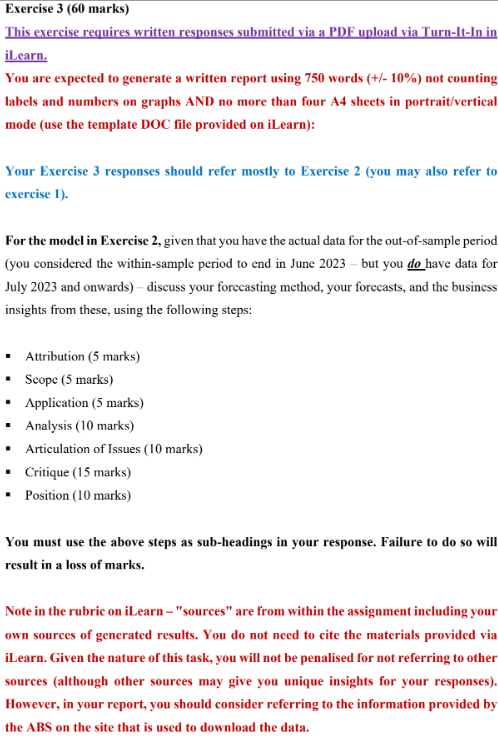
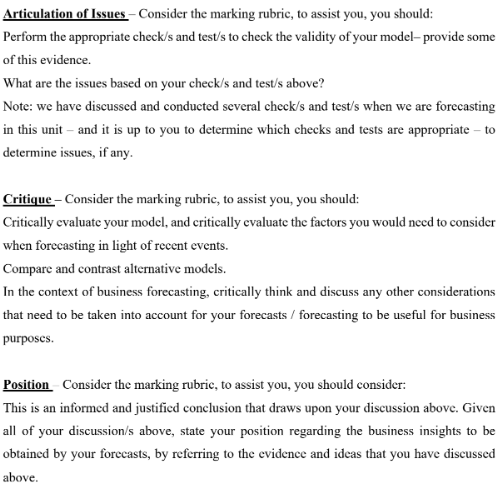
Exercise 1 - Application (10 marks) This exercise involves numerical responses to be submitted via a quiz tool on iLearn For the purposes of this report, only consider the data from July 2015 to June 2023 as the sample of data that is available to you - that is, ignore any recent observations, This means that the first actual observation in your Excel file is from July 2015 and your last actual observation in your Excel file is from June 2023. For the Seasonally adjusted data for the Turnover ; Total (Stare) ; Department stores (Series ID: A33486214.) available in Table 1: Retail Turnover, By Industry Group: Forecast the out-of-sample values for every month in the period July 2023 -June 2024 (both months inclusive) using only one appropriate exponential smoothing model (either simple exponential smoothing or Holt exponential smoothing models that you think is most appropriate given the data). Your starting value for any parameters should be 0.5. Please see the notes on page 5 of this document - regarding seeds. Before you begin Exercise 1, let's check that you have the right data! The average should be 1617! Once you identify and develop an appropriate exponential smoothing model with the starting values for parameter(s)= 0.5, what are the following numerical values: 1. The within-sample forecast for January 2023. 2. The out-of-sample forecast for October 2023. 3. The out-of-sample forecast for June 2024. 4. The MAPE. 5. The MAE. Critically think for a way to optimise alpha and beta (if there is no beta, you can input '0' for question 7) via the MSE, and report the following values after your optimisation: 6. Alpha. 7. Beta. 8. The MAPE. 9. The within-sample forecast for January 2023. 10. The out-of-sample forecast for June 2024.Exercise 2 Application (10 marks) For the purposes of this report, only consider the data from July 2015 to June 2023 as the sample of data that is available to you that is, ignore any recent observations. This means that the first actual observation in yvour Excel file is from July 2005 and your last actual observation in your Excel file is from June 2023. For the Original-adjusted data for the Turnover ;. Total (Stave) ; Department stores (Series ID: A3348618X) available in Table 1 Rerail Twrnover, By Industry Group: Forecast the out-of~sample values for every month in the period July 2023 June 2024 (both months inclusive) using Winter's Exponential Smoothing. Your starting value for any parameter should be 0.5, Please see the notes on page 5 of this document regarding seeds. Before you begin Exercise 2, let's check that vou have the right data! The average should be 16200 Once you perform Winters Exponential Smoothing with alpha, beta and gamma, what arc the following numerical values: 11, The seasonal component for May 2023, 12. The out-of-sample forecast for May 2024, 13. The out-of-sample torecast for June 2024, 14. The MAPE. 15. The MAL. Critically think for a way to optimise alpha, beta, and gamma via the MSE, and report the following values after your optimisation: 16. Alpha 17. Beta 18, Gamma 19. The MAPE 20. The out-of-sample forecast for June 2024, Exercise 3 (60 marks) This exercise requires written responses submitted via a PDF upload via Turn-It-In in iLearn. You are expected to generate a written report using 750 words (+/- 10%) not counting labels and numbers on graphs AND no more than four A4 sheets in portrait/vertical mode (use the template DOC file provided on iLearn): Your Exercise 3 responses should refer mostly to Exercise 2 (you may also refer to exercise 1). For the model in Exercise 2, given that you have the actual data for the out-of-sample period (you considered the within-sample period to end in June 2023 - but you do have data for July 2023 and onwards) - discuss your forecasting method, your forecasts, and the business insights from these, using the following steps: Attribution (5 marks) Scope (5 marks) Application (5 marks) Analysis (10 marks) Articulation of Issues (10 marks) Critique (15 marks) - Position (10 marks) You must use the above steps as sub-headings in your response. Failure to do so will result in a loss of marks. Note in the rubric on iLearn -"sources" are from within the assignment including your own sources of generated results. You do not need to cite the materials provided via iLearn. Given the nature of this task, you will not be penalised for not referring to other sources (although other sources may give you unique insights for your responses). However, in your report, you should consider referring to the information provided by the ABS on the site that is used to download the data.Articulation of Issues - Consider the marking rubric, to assist you, you should: Perform the appropriate check/s and test/'s to check the validity of your model-provide some of this evidence. What are the issues based on your check/s and test/s above? Note: we have discussed and conducted several check/'s and test/'s when we are forecasting in this unit - and it is up to you to determine which checks and tests are appropriate - to determine issues, if any. Critique - Consider the marking rubric, to assist you, you should: Critically evaluate your model, and critically evaluate the factors you would need to consider when forecasting in light of recent events. Compare and contrast alternative models. In the context of business forecasting, critically think and discuss any other considerations that need to be taken into account for your forecasts / forecasting to be useful for business purposes. Position - Consider the marking rubric, to assist you, you should consider: This is an informed and justified conclusion that draws upon your discussion above. Given all of your discussion/s above, state your position regarding the business insights to be obtained by your forecasts, by referring to the evidence and ideas that you have discussed above
Step by Step Solution
There are 3 Steps involved in it
1 Expert Approved Answer
Step: 1 Unlock
Question Has Been Solved by an Expert!
Get step-by-step solutions from verified subject matter experts
Step: 2 Unlock
Step: 3 Unlock
Students Have Also Explored These Related Mathematics Questions!