

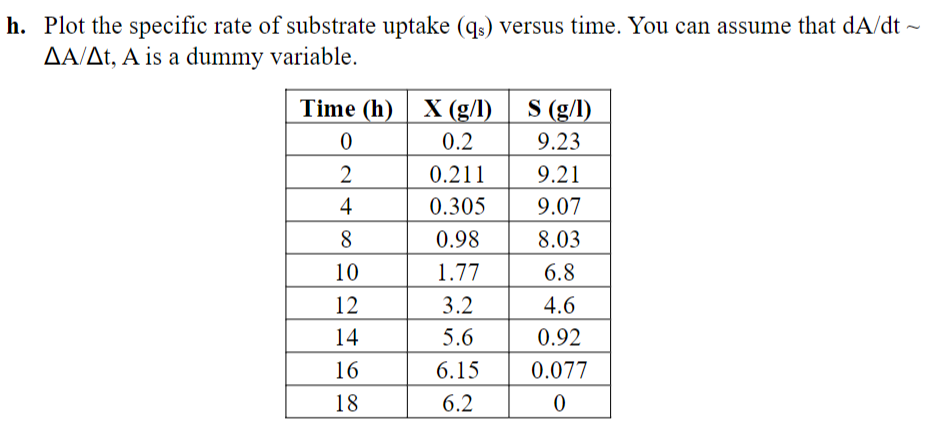
Question: h . Plot the specific rate of substrate uptake ( q s ) versus time. You can assume that d A d t A t
h Plot the specific rate of substrate uptake versus time. You can assume that is a dummy variable.
Step by Step Solution
There are 3 Steps involved in it
1 Expert Approved Answer
Step: 1 Unlock

Question Has Been Solved by an Expert!
Get step-by-step solutions from verified subject matter experts
Step: 2 Unlock
Step: 3 Unlock