

Question: H16 fic B C D E F G. H . J K BALANCE SHEET (in thousands of $s) Actual 20x1 Actual 20x2 Actual 20x3 Forecast
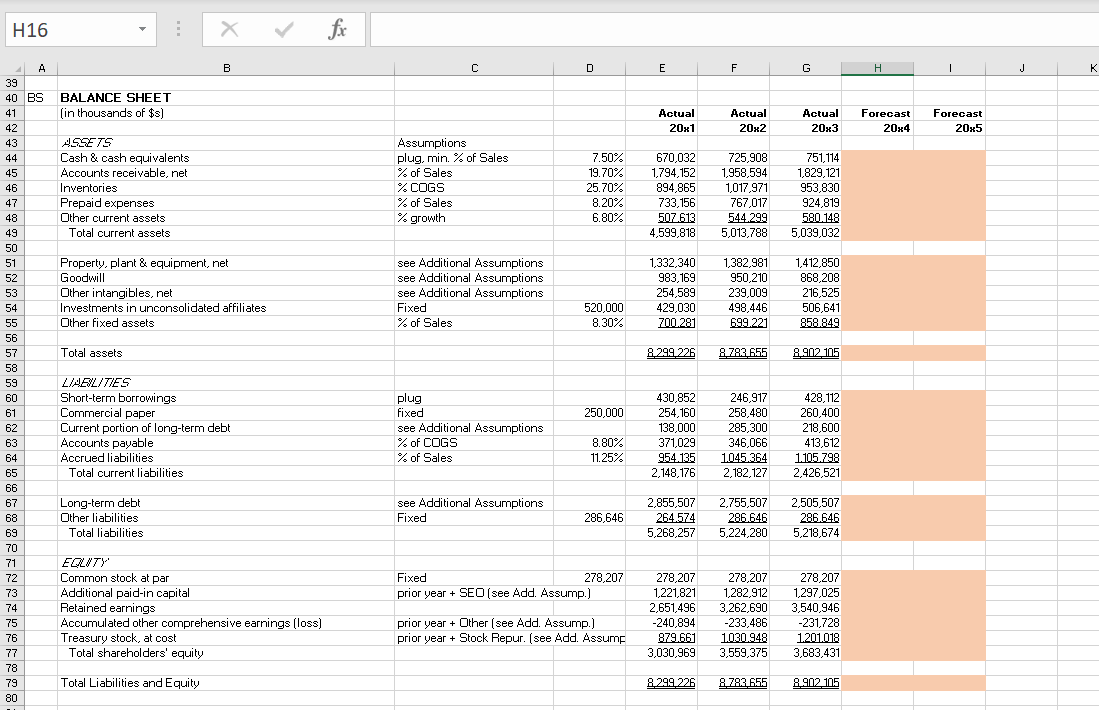
H16 fic B C D E F G. H . J K BALANCE SHEET (in thousands of $s) Actual 20x1 Actual 20x2 Actual 20x3 Forecast 20x4 Forecast 20x5 ASSETS Cash & cash equivalents Accounts receivable, net Inventories Prepaid expenses Other current assets Total current assets Assumptions plug, min. % of Sales % of Sales % COGS % of Sales % growth 7.50% 19.70% 25.70% 8.20% 6.80% 670.032 1,794,152 894.865 733.156 507.613 4,599,818 725,908 1.958.594 1,017,971 767,017 544.299 5,013,788 751,114 1,829.121 953,830 924,819 580.148 5,039,032 Property, plant & equipment, net Goodwill Other intangibles, net Investments in unconsolidated affiliates Other fixed assets see Additional Assumptions see Additional Assumptions see Additional Assumptions Fixed % of Sales 1,332,340 983, 169 254,589 429,030 700.281 1,382.981 950.210 239.009 498,446 699.221 1,412,850 868 208 216.525 506.641 959.849 520,000 8.30% Total assets 8.299.226 8.783 655 8.902 105 39 40 BS 41 42 43 44 45 46 47 48 49 50 51 52 53 54 55 56 57 58 59 60 61 62 63 64 65 66 67 68 69 70 71 72 73 74 75 76 77 78 79 80 250,000 Z/MEYL/TIES Short-term borrowings Commercial paper Current portion of long-term debt Accounts payable Accrued liabilities Total current liabilities plug fixed see Additional Assumptions % of COGS % of Sales 430 852 254,160 138,000 371,029 954.135 2,148,176 246,917 258,480 285,300 346,066 1045,364 2,182,127 428.112 260,400 218,600 413,612 1.105.798 2,426,521 8.80% 11.25% Long-term debt Other liabilities Total liabilities see Additional Assumptions Fixed 286,646 2,855,507 264.574 5,268,257 2,755,507 286.646 5,224,280 2,505,507 286.646 5,218,674 Fixed 278,207 prior year + SEO (see Add. Assump.) EQUITY Common stock at par Additional paid-in capital Retained earnings Accumulated other comprehensive earnings (loss) Treasury stock, at cost Total shareholders' equity 278,207 1.221.821 2,651,496 -240,894 879.661 3,030,969 278,207 1,282,912 3,262.690 -233,486 1030.948 3,559,375 278,207 1,297,025 3,540.946 -231,728 1201.018 3,683,431 prior year + Other (see Add. Assump.) prior year + Stock Repur. (see Add. Assume Total Liabilities and Equity 8 229 226 8.783.655 8.902105 H16 fic B C D E F G. H . J K BALANCE SHEET (in thousands of $s) Actual 20x1 Actual 20x2 Actual 20x3 Forecast 20x4 Forecast 20x5 ASSETS Cash & cash equivalents Accounts receivable, net Inventories Prepaid expenses Other current assets Total current assets Assumptions plug, min. % of Sales % of Sales % COGS % of Sales % growth 7.50% 19.70% 25.70% 8.20% 6.80% 670.032 1,794,152 894.865 733.156 507.613 4,599,818 725,908 1.958.594 1,017,971 767,017 544.299 5,013,788 751,114 1,829.121 953,830 924,819 580.148 5,039,032 Property, plant & equipment, net Goodwill Other intangibles, net Investments in unconsolidated affiliates Other fixed assets see Additional Assumptions see Additional Assumptions see Additional Assumptions Fixed % of Sales 1,332,340 983, 169 254,589 429,030 700.281 1,382.981 950.210 239.009 498,446 699.221 1,412,850 868 208 216.525 506.641 959.849 520,000 8.30% Total assets 8.299.226 8.783 655 8.902 105 39 40 BS 41 42 43 44 45 46 47 48 49 50 51 52 53 54 55 56 57 58 59 60 61 62 63 64 65 66 67 68 69 70 71 72 73 74 75 76 77 78 79 80 250,000 Z/MEYL/TIES Short-term borrowings Commercial paper Current portion of long-term debt Accounts payable Accrued liabilities Total current liabilities plug fixed see Additional Assumptions % of COGS % of Sales 430 852 254,160 138,000 371,029 954.135 2,148,176 246,917 258,480 285,300 346,066 1045,364 2,182,127 428.112 260,400 218,600 413,612 1.105.798 2,426,521 8.80% 11.25% Long-term debt Other liabilities Total liabilities see Additional Assumptions Fixed 286,646 2,855,507 264.574 5,268,257 2,755,507 286.646 5,224,280 2,505,507 286.646 5,218,674 Fixed 278,207 prior year + SEO (see Add. Assump.) EQUITY Common stock at par Additional paid-in capital Retained earnings Accumulated other comprehensive earnings (loss) Treasury stock, at cost Total shareholders' equity 278,207 1.221.821 2,651,496 -240,894 879.661 3,030,969 278,207 1,282,912 3,262.690 -233,486 1030.948 3,559,375 278,207 1,297,025 3,540.946 -231,728 1201.018 3,683,431 prior year + Other (see Add. Assump.) prior year + Stock Repur. (see Add. Assume Total Liabilities and Equity 8 229 226 8.783.655 8.902105
Step by Step Solution
There are 3 Steps involved in it

Get step-by-step solutions from verified subject matter experts