

Question: H23 V X V fx A B C D E F G H K L 1 Part 3 - Regression Analysis N Q 13. Run
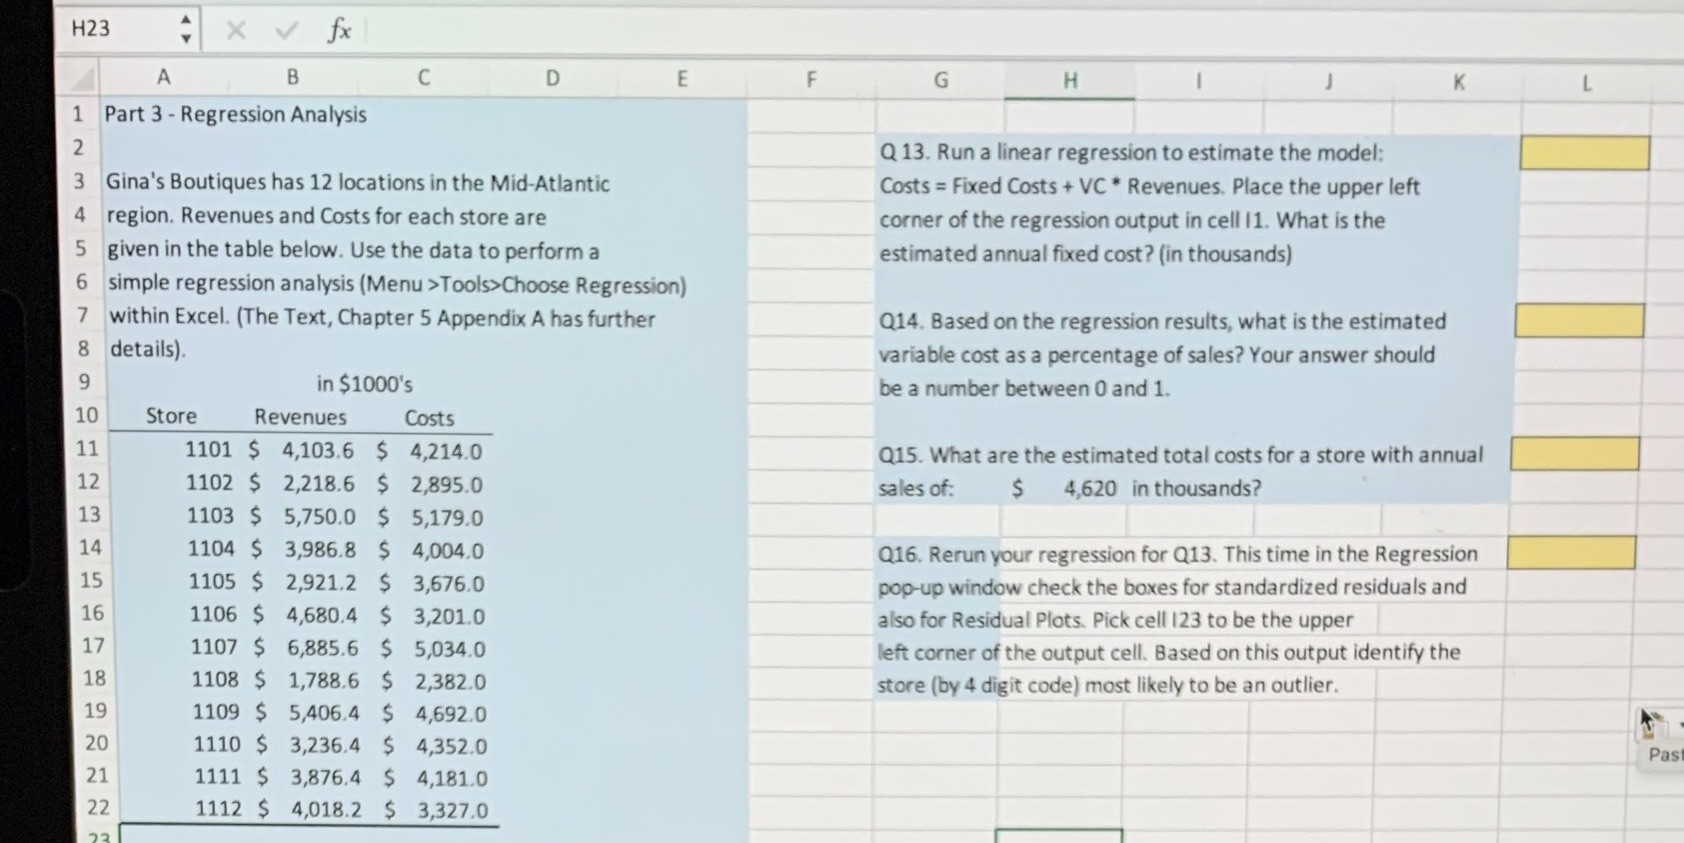
H23 V X V fx A B C D E F G H K L 1 Part 3 - Regression Analysis N Q 13. Run a linear regression to estimate the model: 3 Gina's Boutiques has 12 locations in the Mid-Atlantic Costs = Fixed Costs + VC * Revenues. Place the upper left 4 region. Revenues and Costs for each store are corner of the regression output in cell 11. What is the 5 given in the table below. Use the data to perform a estimated annual fixed cost? (in thousands) 6 simple regression analysis (Menu >Tools>Choose Regression) 7 within Excel. (The Text, Chapter 5 Appendix A has further Q14. Based on the regression results, what is the estimated 8 details). variable cost as a percentage of sales? Your answer should 9 in $1000's be a number between 0 and 1. 10 Store Revenues Costs 11 1101 $ 4,103.6 $ 4,214.0 Q15. What are the estimated total costs for a store with annual 12 1102 $ 2,218.6 $ 2,895.0 sales of: $ 4,620 in thousands? 13 1103 $ 5,750.0 $ 5,179.0 14 1104 $ 3,986.8 $ 4,004.0 Q16. Rerun your regression for Q13. This time in the Regression 15 1105 $ 2,921.2 $ 3,676.0 pop-up window check the boxes for standardized residuals and 16 1106 $ 4,680.4 $ 3,201.0 also for Residual Plots. Pick cell 123 to be the upper 17 1107 $ 6,885.6 $ 5,034.0 left corner of the output cell. Based on this output identify the 18 1108 $ 1,788.6 $ 2,382.0 store (by 4 digit code) most likely to be an outlier. 19 1109 $ 5,406.4 $ 4,692.0 20 1110 $ 3,236.4 $ 4,352.0 Past 21 1111 $ 3,876.4 $ 4,181.0 22 1112 $ 4,018.2 $ 3,327.0
Step by Step Solution
There are 3 Steps involved in it

Get step-by-step solutions from verified subject matter experts