

Question: H3 You have been given a comparative balance sheet for 2018 and 2017 and the Income Statement for 2018. Comparative Balance Sheet Current Assets Sales.
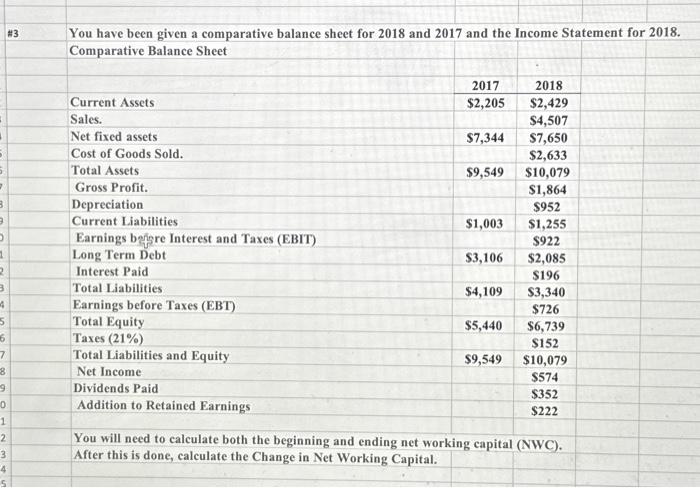
H3 You have been given a comparative balance sheet for 2018 and 2017 and the Income Statement for 2018. Comparative Balance Sheet Current Assets Sales. Net fixed assets Cost of Goods Sold. Total Assets Gross Profit. Depreciation Current Liabilities Earnings befrere Interest and Taxes (EBIT) Long Term Debt Interest Paid Total Liabilities Earnings before Taxes (EBT) Total Equity Taxes (21%) Total Liabilities and Equity Net Income Dividends Paid Addition to Retained Earnings 2017 2018 $9,549$10,079 $1,864 $952 $1,003$1,255 $922 $3,106$2,085 $196 $4,109$3,340 $726 $5,440$6,739 $152 $9,549$10,079 $574 $352 $222 You will need to calculate both the beginning and ending net working capital (NWC). After this is done, calculate the Change in Net Working Capital
Step by Step Solution
There are 3 Steps involved in it

Get step-by-step solutions from verified subject matter experts