

Question: You have been given a comparative balance sheet for 2018 and 2017 and the Income Statement for 2018. Comparative Balance Sheet 2017 2018 2018 Current
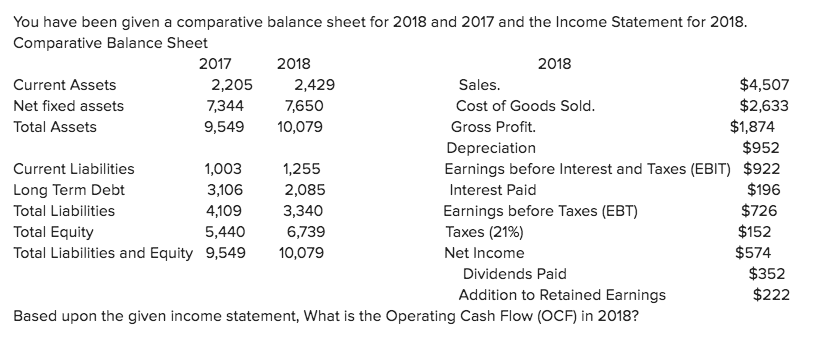
You have been given a comparative balance sheet for 2018 and 2017 and the Income Statement for 2018. Comparative Balance Sheet 2017 2018 2018 Current Assets 2,205 2,429 Sales. $4,507 Net fixed assets 7,344 7,650 Cost of Goods Sold. $2,633 Total Assets 9,549 10,079 Gross Profit $1,874 Depreciation $952 Current Liabilities 1,003 1,255 Earnings before Interest and Taxes (EBIT) $922 Long Term Debt 3,106 2,085 Interest Paid $196 Total Liabilities 4,109 3,340 Earnings before Taxes (EBT) $726 Total Equity 5,440 6,739 Taxes (21%) $152 Total Liabilities and Equity 9,549 10,079 Net Income $574 Dividends Paid $352 Addition to Retained Earnings $222 Based upon the given income statement, What is the Operating Cash Flow (OCF) in 2018? $1,722 O $1,874 $1,100 O $922 Based upon the given income statement, What is the Operating Cash Flow (OCF) in 2018? Multiple Choice $1,722 O $1,874 $1,100 $922 Find the Net Capital Spending (NCS) for the year by looking at the change in Fixed Assets. Make sure you remember to account for depreciation. What is the net capital spending in 2018? Multiple Choice $8,296 $1,258 $306 $8,602 You will need to calculate both the beginning and ending net working capital (NWC). After this is done, calculate the Change in Net Working Capital. Multiple Choice $28 $1,174 -$28 $1,202 Refer to the income statement and balance sheet. Focus on the Long-term borrowing and the interest paid in 2018, What is the Cash Flow to Creditors? Multiple Choice $1,021 O $1,225 $825 O $1,217 After reviewing teh dividends paid, the change in total equity and the the addition to Retained Earnings, Calculate the Cash Flow to Stockholders (CFS). Multiple Choice $725 $1,077 O - $725 $865
Step by Step Solution
There are 3 Steps involved in it

Get step-by-step solutions from verified subject matter experts